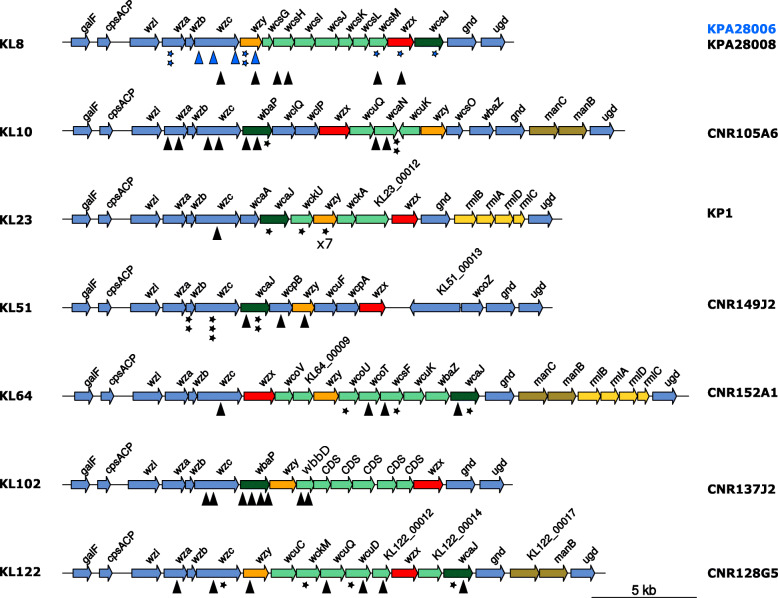
Fig. 1.
Capsular loci maps. Capsular regions from the seven capsular types investigated in this work are represented from galF to ugd. Genes are indicated by arrows. Blue arrows correspond to core genes from the different capsule loci. Glycosyltransferases are indicated in green. Orange and red arrows represent genes encoding the polymerase and the flippase, respectively. In yellow/dark yellow the genes involved in sugar/repeat unit synthesis (non-conserved). KL numbers are indicated on the left and the analyzed strain of each K-type on the right. IS insertions are represented by triangles and other mutations events by stars as specified in Table 2. Two strains of capsular type KL8 were investigated, blue signs correspond to KPA28006 and black ones to KPA28008

