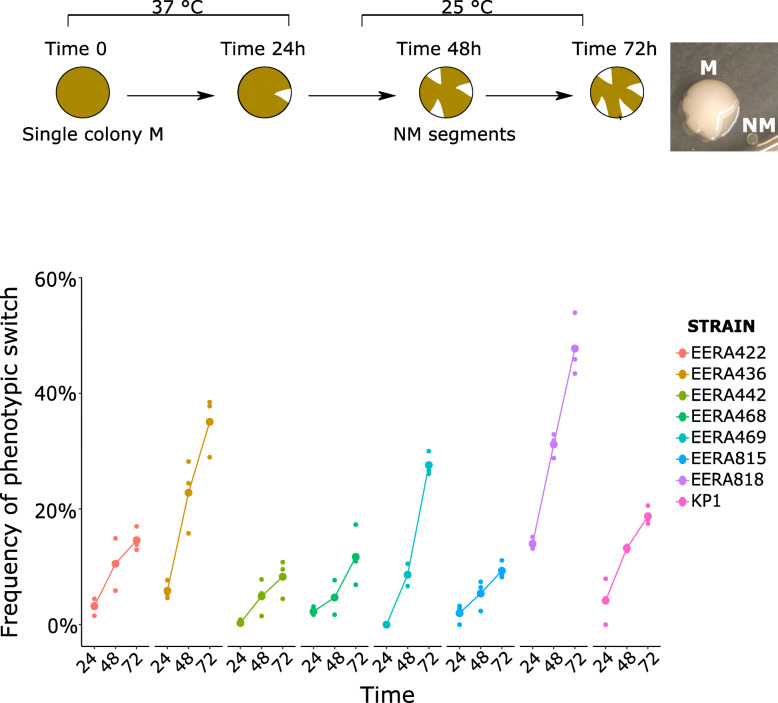
Fig. 2.
Frequency of phenotypic switch in the eight CPKp isolates. a. Left: Workflow followed to visualize and quantify the colony switch from mucoid to non-mucoid phenotype; right: two colonies with NM sectors. b. Frequency of phenotypic variation (colony with non-mucoid sectors) monitored over 72 h in the eight CPKp strains. The first 24 h, the isolates were incubated at 37 °C then at 25 °C to observe the appearance of NM segments. M = mucoid, NM = non-mucoid. Strain names are indicated according to the figure key. Frequency and standard deviations are given in Table S4

