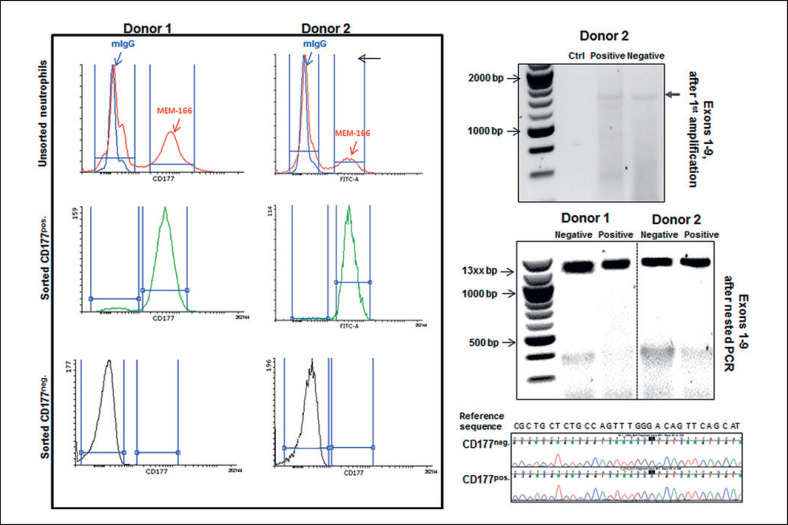
Fig. 6.
Analysis of sorted HNA-2-positive and HNA-2-negative neutrophil subpopulations. Neutrophils were labeled with FITC-MEM166 or FITC-mIgG and the subsets were sorted to positive and negative subpopulations according to mean fluorescent intensity (left panel). mRNA content of sorted subpopulations was isolated and converted to cDNA. CD177 cDNA was amplified by primers flanking exons 1–9. The very weak bands representing the products of the first PCR reaction covering exons 1–9 of the CD177pos.and the CD177neg.fraction of one donor as well as an aqua control are shown in the upper right panel. After the 2nd round of amplification of the nested PCR, CD177 cDNA is presented in the CD177neg.and CD177pos.fractions of 2 donors. The sequencing chromatograms exemplarily show sequence homology in the exon 2 amplicons of both CD177neg.and CD177pos.subpopulations of donor 2 with the CD177 reference sequence (NM_020406.4) for comparison.

