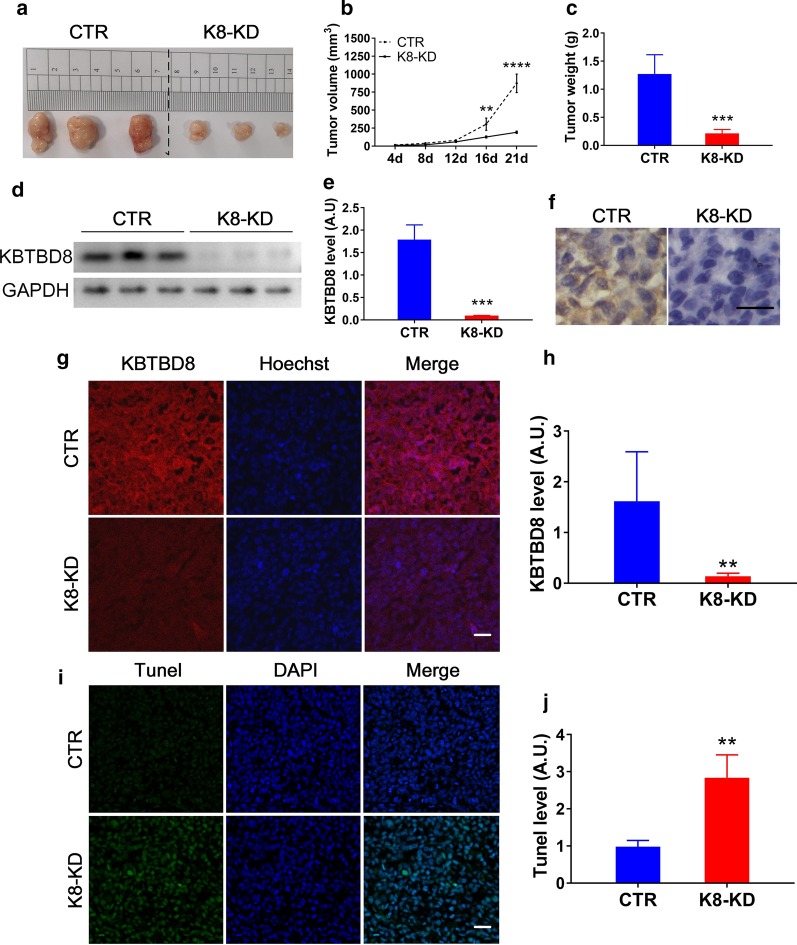
Fig. 7.
KBTBD8 knockdown suppressed tumor formation in vivo in A2780 cell xenograft model. a–c In vivo tumor formation assay in A2780 cell xenograft model. Both tumor volume (tumor volume at 21d, CTR vs. K8-KD, 872.7mm3 vs. 191.7 mm3) and tumor weight (tumor weight at 21d, CTR vs. K8-KD, 1.270 g vs. 0.2142 g) were significantly reduced in the KBTBD8-knockdown A2780 cell xenograft group. d, e Western blot and quantification showed that the KBTBD8 protein level was still significantly lower (KBTBD8 level, CTR vs. K8-KD, 1.790 vs. 0.09559) in the KBTBD8-knockdown group at the examination time point. f Immunohistochemistry of tumor tissues verified that KBTBD8 signal was still significantly lower in the KBTBD8-knockdown group at the examination time point (Three weeks after the xenograft). g, h Immunofluorescence also showed that KBTBD8 signal was still significantly lower (KBTBD8 signal, CTR vs. K8-KD, 1.619 vs. 0.1354) in the KBTBD8-knockdown group at the examination time. KBTBD8 in red, DNA in blue. i, j Tunel assay showed that apoptosis signal significantly increased in KBTBD8-knockdown tumor than in control (Tunel level, CTR vs. K8-KD, 0.9770 vs. 2.840). Tunel signal in green, DNA in blue. Scale bar, 50 μm. **Indicates p < 0.01, ***indicates p < 0.001, ****indicates p < 0.0001

