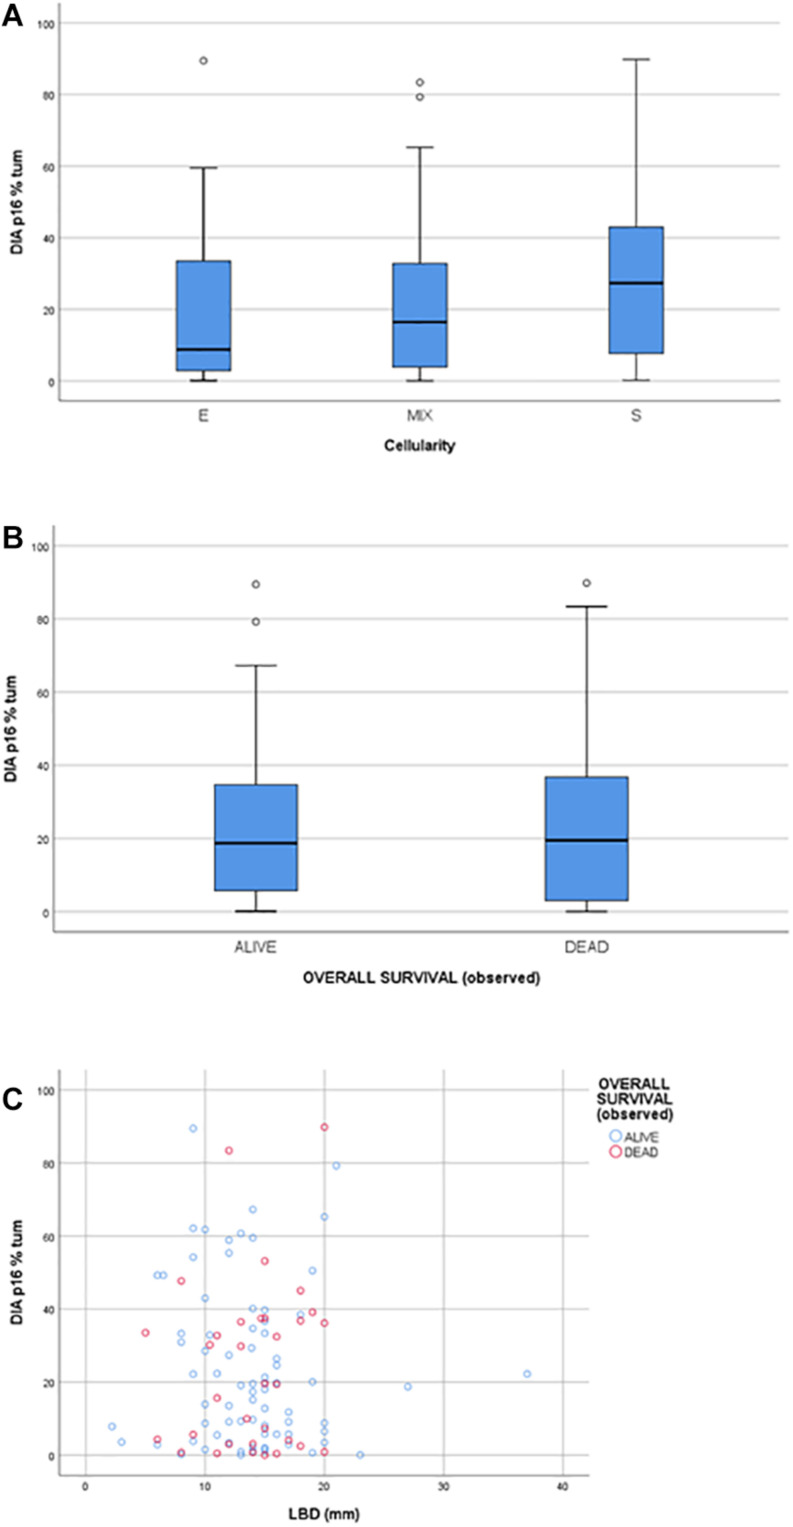
FIGURE 4.
(A) box plot showing the distribution of P16INK4a positivity across the Cellularity categories (E: epithelioid, S: spindle; MIX: mixed). (B) box plot showing the distribution of P16INK4a positivity between the two Overall Survival categories: alive and dead. (C) scatter plot matching P16INK4a positivity and LBD (larger basal diameter).

