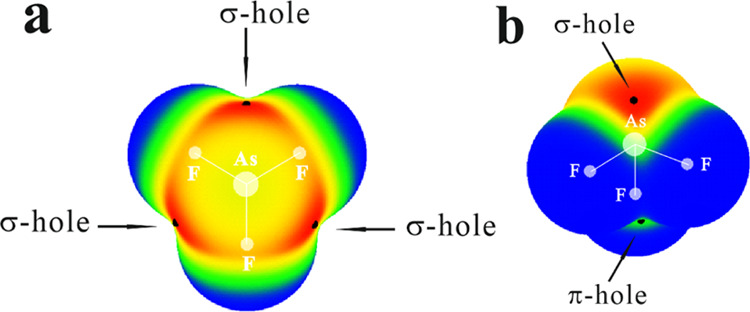
Figure 1.

MEP on the 0.001 au isodensity surface at the MP2/cc-pVDZ level of AsF3 (a, top view and b, bottom view) isolated monomers. Color ranges, in kcal/mol, are red greater than 35, yellow between 15 and 35, green between 0 and 15, and blue below 0 kcal/mol.
