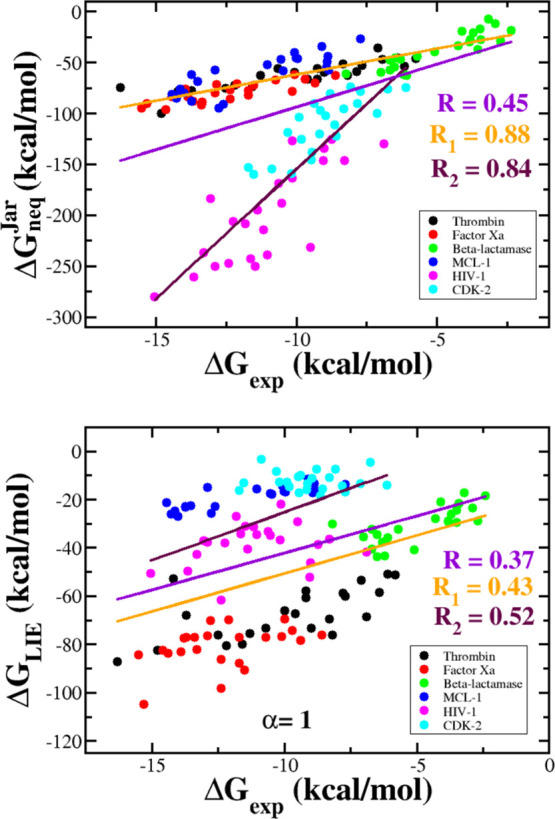
Figure 6.

Correlation between the ΔGneqJar (upper panel) and ΔGLIE (lower panel) with the experimental binding free energy for combined data sets. Straight lines refer to the linear fit for all six data sets (violet, correlation R), the combined set of thrombin, factor Xa, β-lactamase, and MCL-1 (orange, correlation R1), and the combined set of HIV-1 and CDK-2 (maroon, correlation R2). For JE, we obtained R = 0.45, R1 = 0.88, and R2 = 0.84, whereas for LIE, we obtained R = 0.37, R1 = 0.43, and R2 = 0.52.
