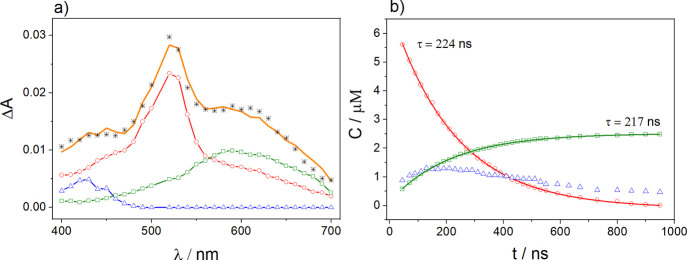
Figure 6.
(a) Resolutions of transient absorption spectra taken 150 ns after the 355 nm laser pulsing of a deoxygenated solution of BP (2.5 × 10⁻³ M) and anisole (4.6 × 10⁻³ M) in ACN–H2O (1:4 v/v), pH 11; (b) concentration profiles for the BP triplet state, BP radical anion, and anisole radical cation obtained from resolutions of the transient absorption spectra. The symbols represent: ○ triplet state 3BP; Δ anisole radical cation; □ BP radical anion; and * experimental data; solid curves in (a,b) are the resulting fits from the regression analyses, the number represents the value obtained from the fit to the triplet concentration profile.

