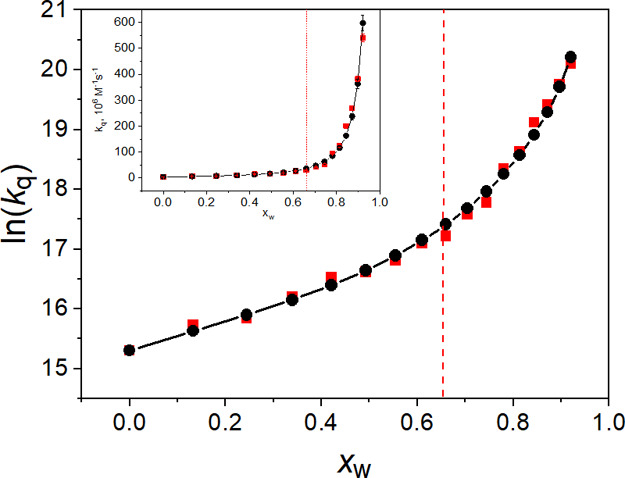
Figure 8.

Solvent-composition dependence of the quenching rate constant kq in the system BP–anisole in the ACN–H2O solvent: experimental (red squares); calculated from eq 8 using kET = (1.46 ± 0.01) × 109 M–1 s–1; PQ = 53 ± 1 (black solid line + circles). The experimental data uncertainty is 3%. The inset shows the data in the non-logarithmic form.
