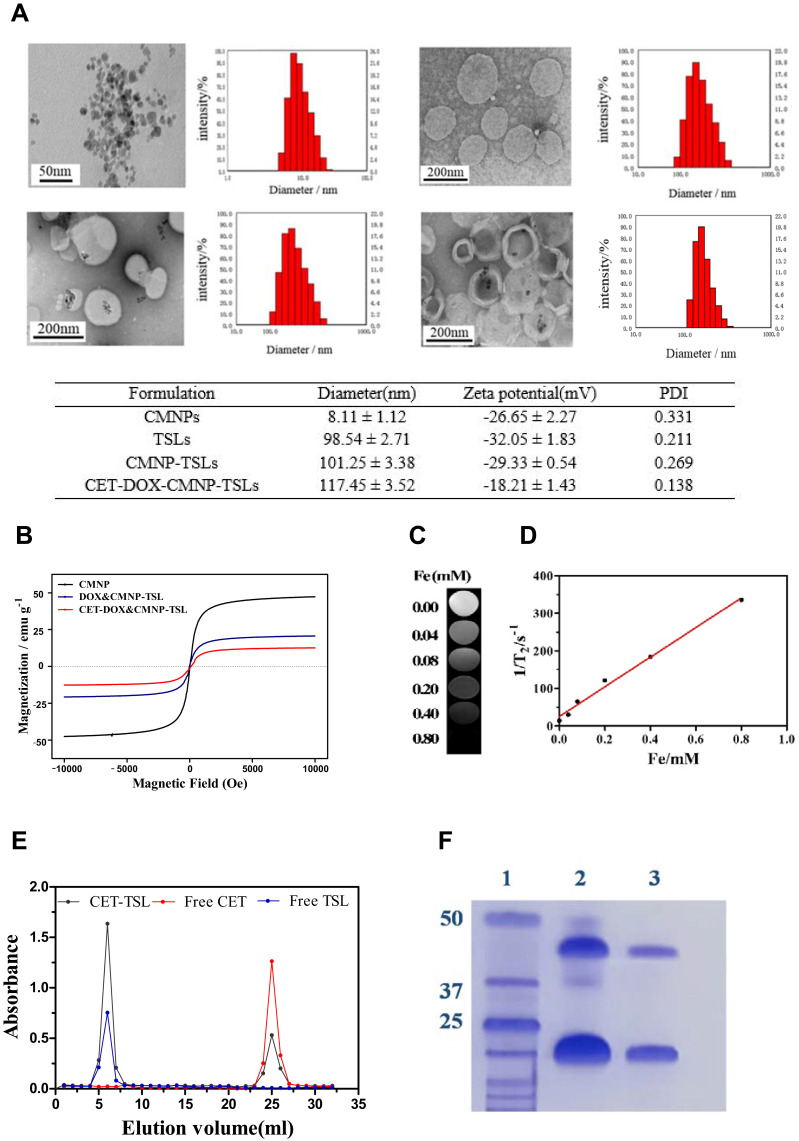
Figure 2.
Characterization of CMNPs, TSLs, CMNPs–TSLs, and CET-DOX-CMNP-TSLs. (A) TEM images and size distributions as measured by DLS; (B) Normalized field-dependent magnetization curve for the CMNPs and CMNP-TSLs; (C) T2-Weighted MR images of CMNP –TSLs aqueous solutions with various Fe concentrations; (D) Plot of 1/T2 over Fe ion concentration (mM) of the CMNP–TSLs aqueous solution, the slope indicates the specific relaxivity (r2); (E) Chromatogram for CET-TSLs, Free CET and Free TSLs; and (F) SDS-Page electrophoresis profile of the (1) Protein ladder, (2) CET and (3) CET-TSLs.

