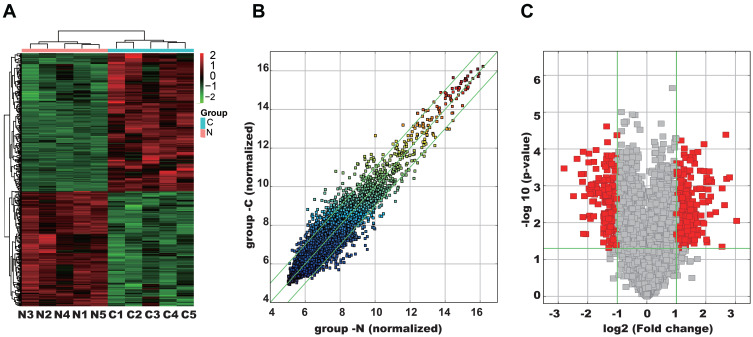
Figure 1.
Analysis of differentially expressed circRNAs in five paired lung adenocarcinoma tissues and adjacent normal tissues. (A) Hierarchical clustering results of circRNA expression profiles between the lung adenocarcinoma tissues and matched normal tissues. The result from unsupervised hierarchical clustering analysis reveals distinguishable circRNAs expression profiling among specimens. Red: higher expression level, green: lower expression level. (B) CircRNAs in the scatter plot above the top green line and below the bottom green line indicate change of circRNAs between the two groups (P< 0.05). (C) Volcano plot of circRNA expression profile. The vertical lines correspond to 2.0-fold upregulation and downregulation, and the horizontal line represents a P-value of 0.05. The red point in the plot represents the differentially expressed circRNAs with statistical significance.
Abbreviations: N, adjacent normal tissues; C, lung adenocarcinoma tissues.

