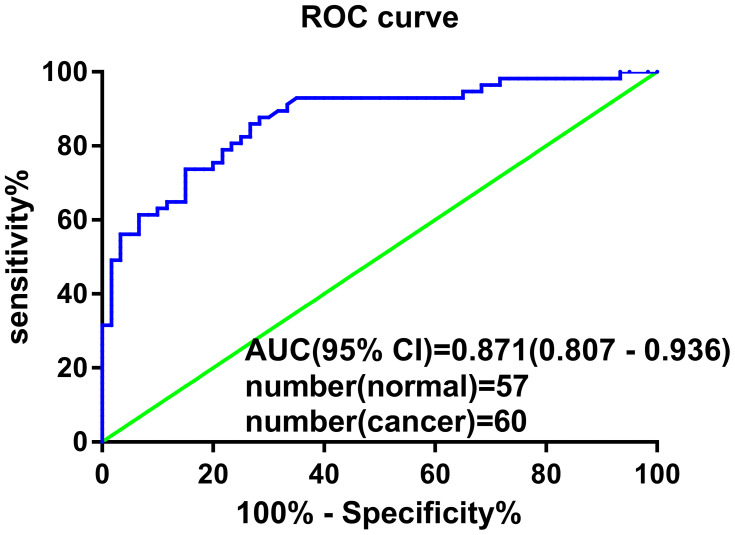
Figure 4.
ROC curve of plasma hsa_circ_0001715. Plasma hsa_circ_0001715 had an AUC value of 0.871 (95% CI: 0.807–0.936) to discriminate patients with lung adenocarcinoma from healthy controls. With a cutoff of 7.58, the sensitivity, specificity and accuracy were 87.72%, 71.67% and 79.49%, respectively.
Abbreviation: ROC, receiver operating characteristic.

