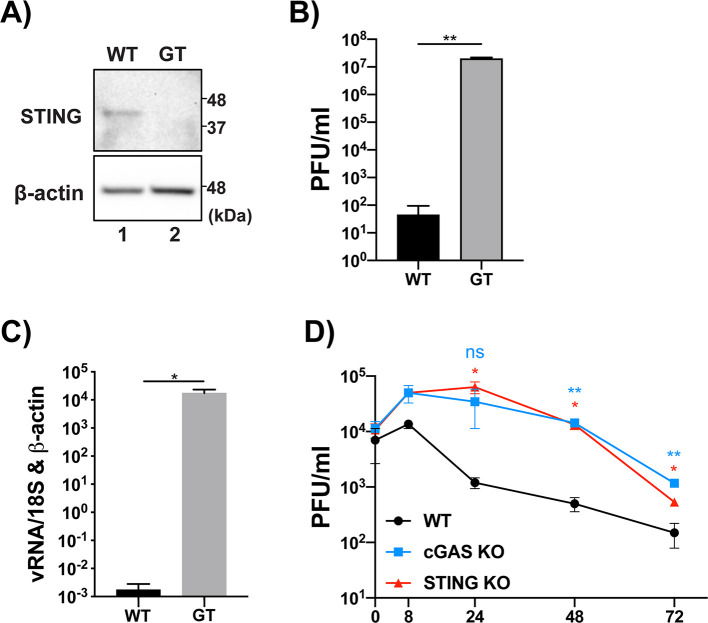
Fig 3. cGAS and STING restrict CHIKV replication and infectious particle release.
(A) WT or GT MEFs we lysed and analyzed via SDS-PAGE and immunoblotting. (B) WT and GT MEFs infected with CHIKV 181/25 (MOI = 0.1) for 16hr. infectious particles in the supernatant were quantified via plaque assay. (C) RT-qPCR of viral RNA (nsp2) relative to 18S and b-actin. (A-C) representative of three independent experiments. Data are represented by means ± SD (n = 3). Statistical analysis was done with student’s t tests. (D) WT, cGAS KO, or STING KO RAW 264.7 cells were infected with CHIKV 181/25 (MOI = 0.1) and supernatants were collected at indicated timepoints. Infectious particle release in the supernatant was quantified via plaque assay. Data representative of three independent experiments. Data are represented by means ± SD (n = 3). Statistical analysis was done via two-way ANOVA with Tukey’s multiple comparisons. Statistical significance represented as follows: ns = not significant, * = p<0.05, ** = p<0.01, *** = p<0.001.

