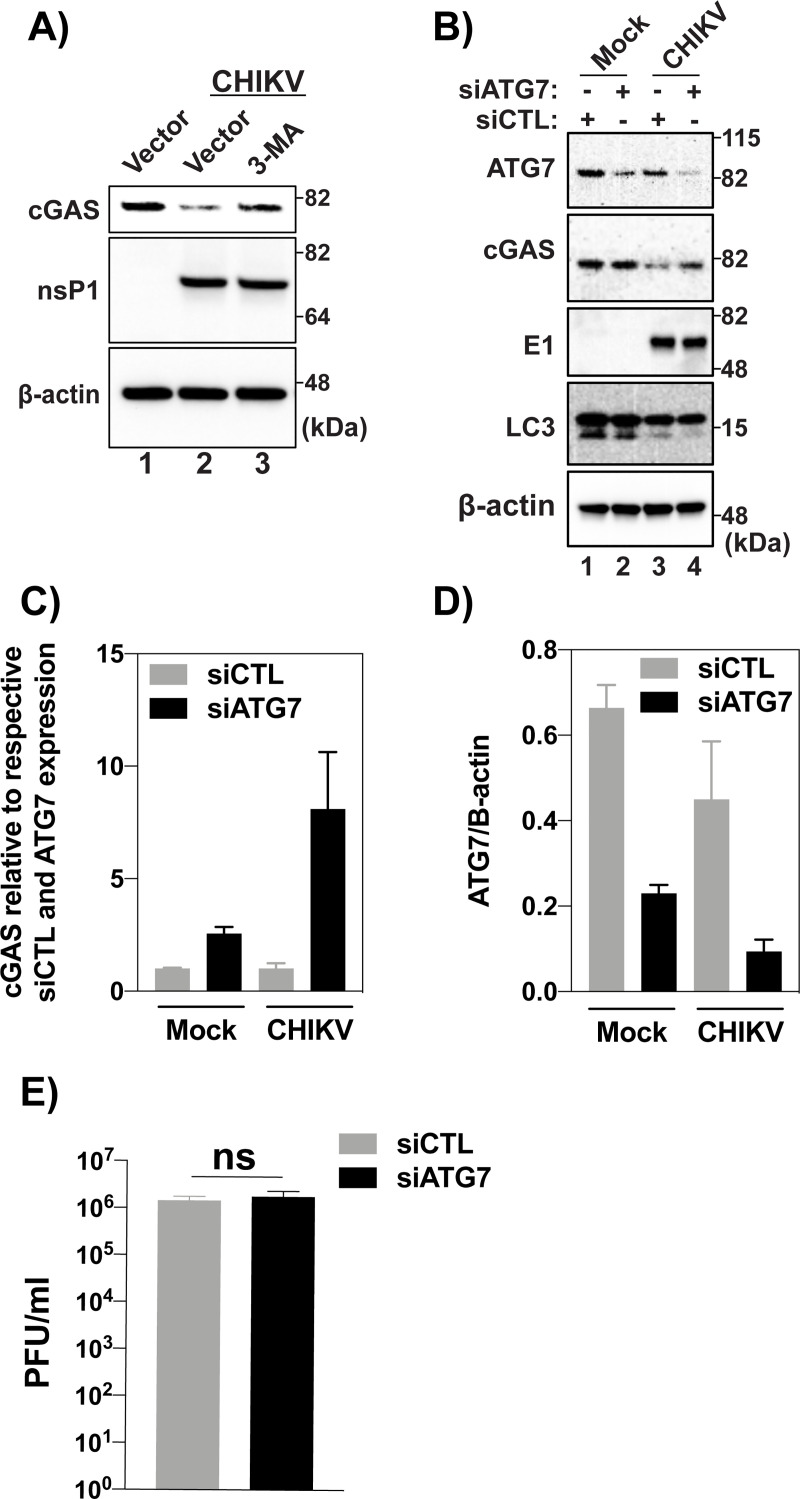
Fig 5.
(A) 293Ts transfected with 200 ng cGAS for 16hrs then infected with CHIKV at an MOI of 10.0. Infections were allowed to proceed for 10 hrs before treatment with 3-MA at 5 mM. Cells were allowed to rest for 8 hrs after drug treatment and were lysed. Lysates were visualized via SDS-PAGE followed by immunoblotting with indicated antibodies. (Data representative of three independent experiments). (B) U2OS cells were transfected with 10 nm siRNA (control or ATG7) for 48 hrs and infected 24 hpt with CHIKV (MOI = 10) or mock infection. Cells were collected and lysed 24 hpi. Analysis by western blot using indicated antibodies. (C) Fold change in cGAS expression relative to respective non-targeting siRNA controls and ATG7 expression via densitometry analysis of western blot bands in figure (n = 2) (B). (D) Quantification of ATG7 knockdown in U2OS cells from western shown in figure (B) (n = 2). (E) Plaque assay of supernatants collected from infected U2OS cells at 24hrs post infection (n = 3) Data are represented as means ± SD. (B-E) Data representative of two independent experiments. Statistical analysis was done with student’s t test.

