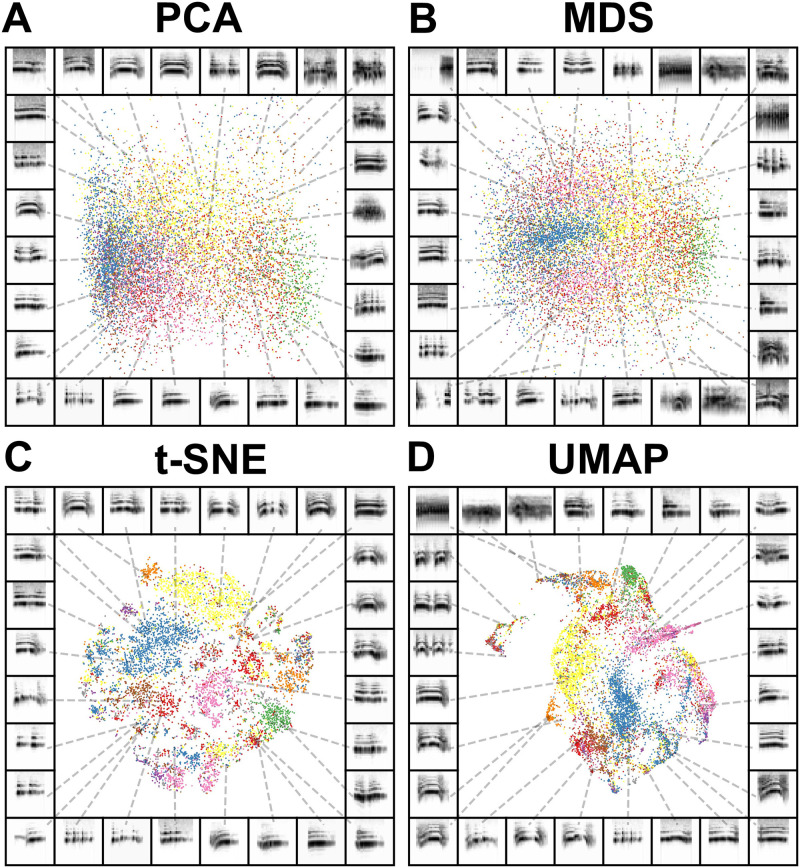
Fig 2. Comparison between dimensionality reduction and manifold learning algorithms.
Isolation calls from 12 juvenile Egyptian fruit bats, where spectrograms of vocalizations are projected into two dimensions in (A) PCA, (B) MDS, (C) t-SNE, and (D) UMAP. In each panel, each point in the scatterplot corresponds to a single isolation call. The color of each point corresponds to the ID of the caller. The frame of each panel is a spectrogram of an example syllable, pointing to where that syllable lies in the projection.

