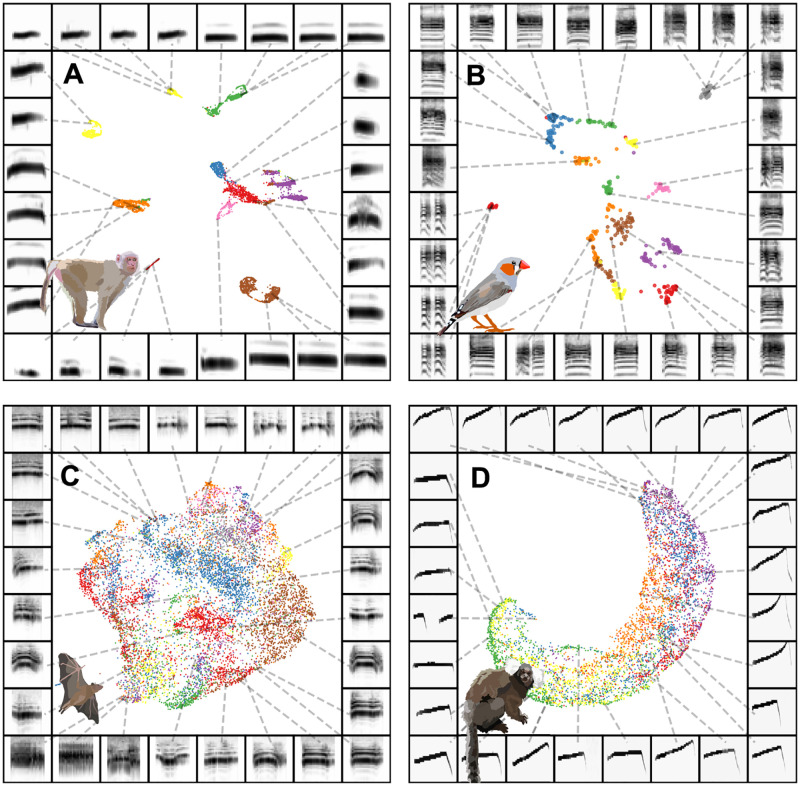
Fig 4. Individual identity is captured in projections for some datasets.
Each plot shows vocal elements discretized, spectrogrammed, and then embedded into a 2D UMAP space, where each point in the scatterplot represents a single element (e.g. syllable of birdsong). Scatterplots are colored by individual identity. The borders around each plot are example spectrograms pointing toward different regions of the scatterplot. (A) Rhesus macaque coo calls. (B) Zebra finch distance calls. (C) Fruit bat infant isolation calls. (D) Marmoset phee calls.

