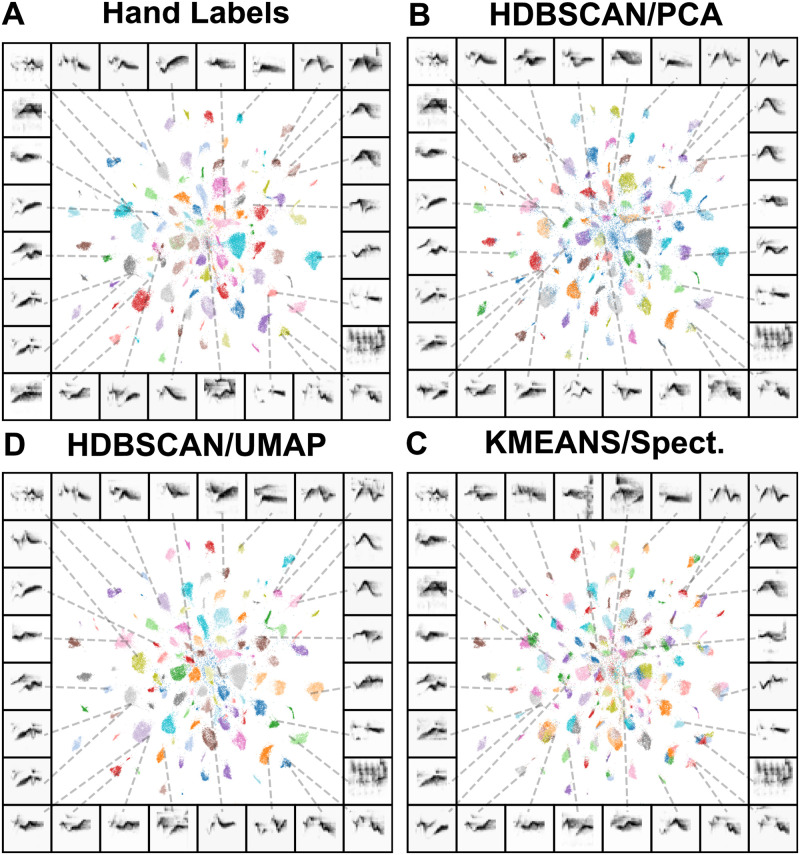
Fig 10. Clustered UMAP projections of Cassin’s vireo syllable spectrograms.
Panels (A-D) show the same scatterplot, where each point corresponds to a single syllable spectrogram projected into two UMAP dimensions. Points are colored by their hand-labeled categories (A), which generally fall into discrete clusters in UMAP space. Remaining panels show the same data colored according to cluster labels produced by (B) HDBSCAN over PCA projections (100 dimensions), (C) HDBSCAN on UMAP projections, and (D) k-means directly on syllable spectrograms.

