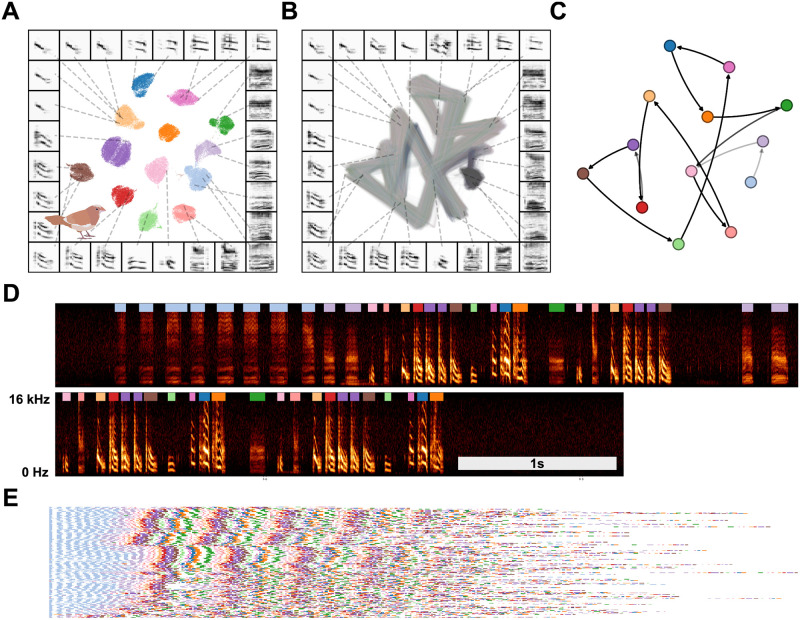
Fig 12. Latent visualizations of Bengalese finch song sequences.
(A) Syllables of Bengalese finch songs from one individual are projected into 2D UMAP latent space and clustered using HDBSCAN. (B) Transitions between elements of song are visualized as line segments, where the color of the line segment represents its position within a bout. (C) The syllable categories and transitions in (A) and (B) can be abstracted to transition probabilities between syllable categories, as in a Markov model. (D) An example vocalization from the same individual, with syllable clusters from (A) shown above each syllable. (E) A series of song bouts. Each row is one bout, showing overlapping structure in syllable sequences. Bouts are sorted by similarity to help show structure in song.

