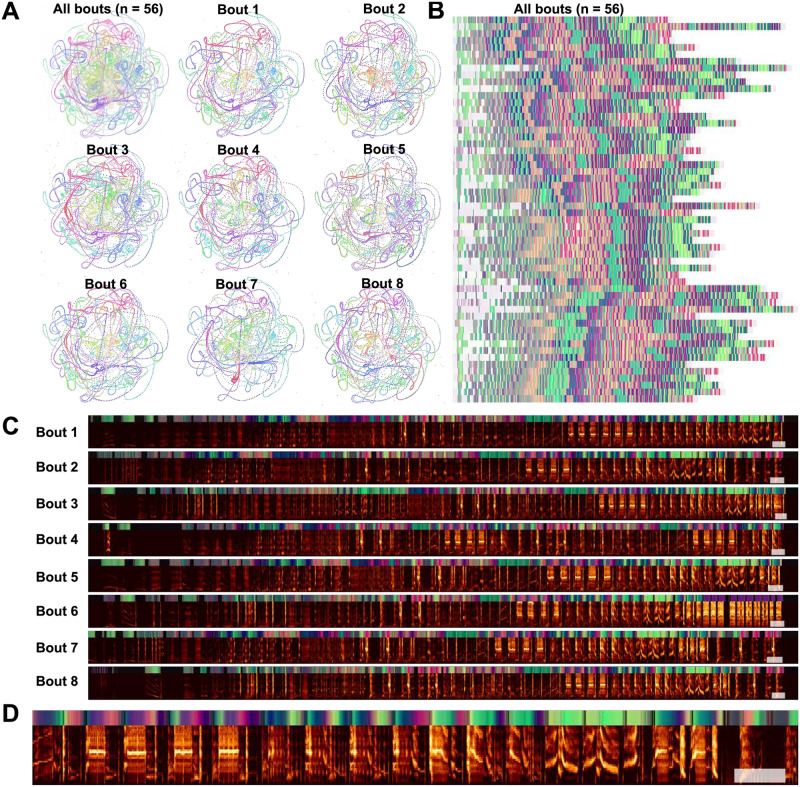
Fig 16. Starling bouts projected into continuous UMAP space.
(A) The top left panel is each of 56 bouts of starling song projected into UMAP with a rolling window length of 200ms, color represents time within the bout. Each of the other 8 panels is a single bout, demonstrating the high similarity across bouts. (B) Latent UMAP projections of the 56 bouts of song projected into colorspace in the same manner as Fig 15M. Although the exact structure of a bout of song is variable from rendition to rendition, similar elements tend to occur at similar regions of song and the overall structure is preserved. (C) The eight example bouts from (A) with UMAP colorspace projections above. The white box at the end of each plot corresponds to one second. (D) A zoomed-in section of the first spectrogram in C.

