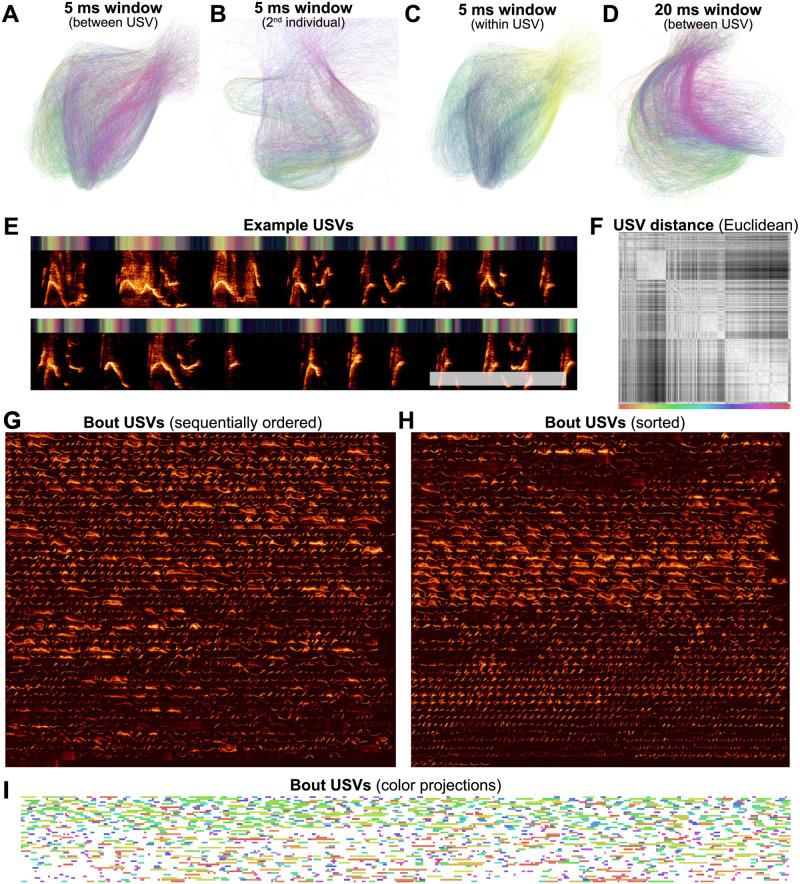
Fig 17. USV patterns revealed through latent projections of a single mouse vocal sequence.
(A) Each USV is plotted as a line and colored by its position within the sequence. Projections are sampled from a 5ms rolling window. (B) Projections from a different recording from a second individual using the same method as in (A). (C) The same plot as in A, where color represents time within a USV. (D) The same plot as in (A) but with a 20ms rolling window. (E) An example section of the USVs from (A), where the bar on the top of the plot shows the UMAP projections in colorspace (the first and second UMAP dimensions are plotted as color dimensions). 2The white scale bar corresponds to 250ms. (F) A distance matrix between each of 1,590 USVs produced in the sequence visualized in (A), reordered so that similar USVs are closer to one another. (G) Each of the 1,590 USVs produced in the sequence from (A), in order (left to right, top to bottom). (H) The same USVs as in (G), reordered based upon the distance matrix in (F). (I) The entire sequence from (A) where USVs are color-coded based upon their position in the distance matrix in (F).

