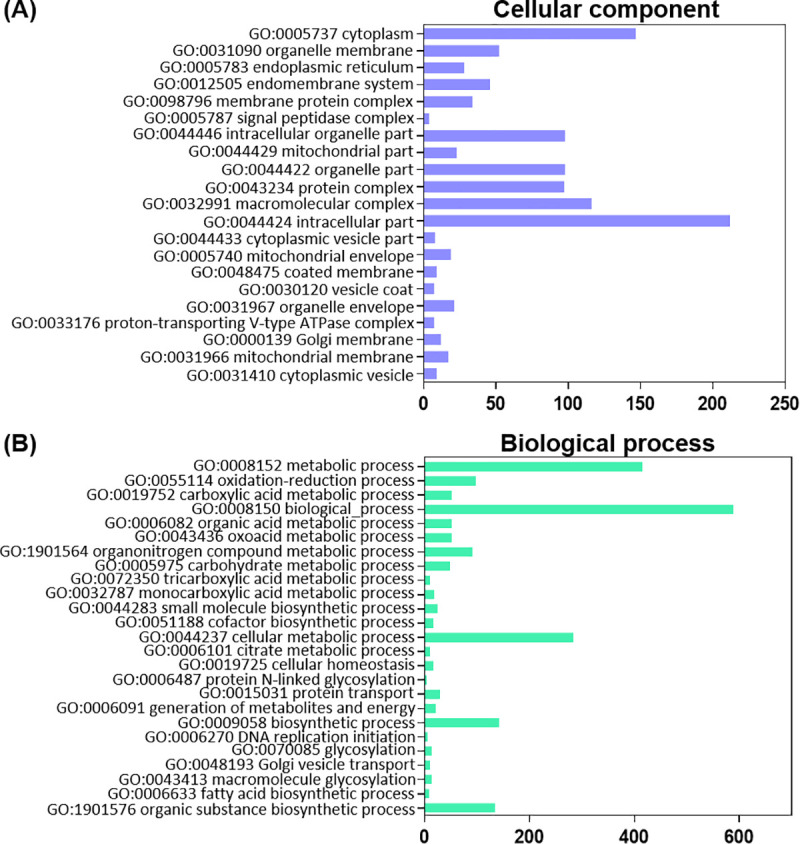
Fig 1. Distribution of differentially expressed genes (DEG) in the fat body annotated by GO enrichment analysis, associated with cellular components and biological processes.

The GO enrichment bar chart presents the number of DEG enriched in cellular component (A) and biological process (B). The y-axis is GO terms enriched and the x-axis is the number of DEG. GO terms with corrected P-value less than 0.05 were considered significantly enriched in DEG (comparing FB_FC vs FB_UFC). The most significant enriched terms relevant to our analysis are shown. FB_FC, fat body in fed condition; FB_UFC, fat body in unfed condition.
