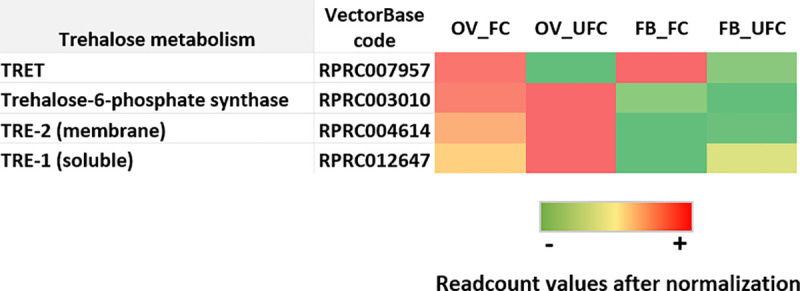
Fig 6. Heat map comparing the mRNA expression levels of molecules involved in trehalose metabolism in fat body and ovaries of female adults in different nutritional condition.

The input data is the readcount value from the gene expression level analysis after normalization and is presented by means of a colour scale, in which green/yellow/red represent lowest/moderate/highest expression. DESeq was used to perform the analysis.
