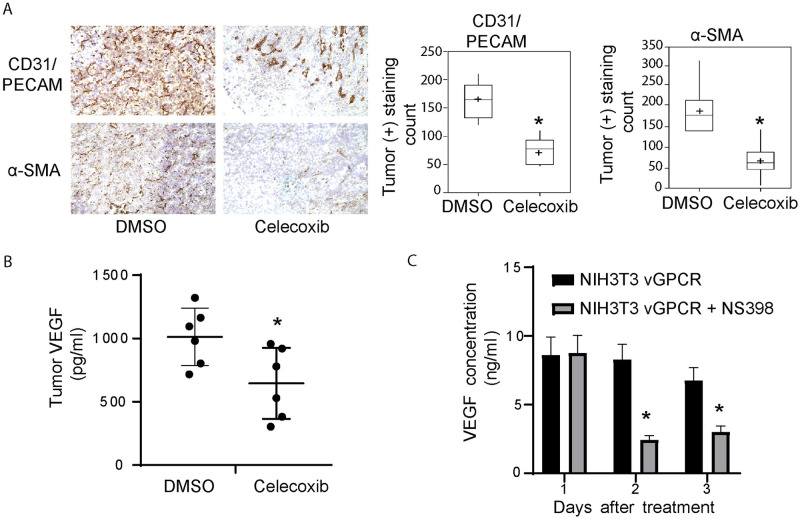
Fig 7. Celecoxib treatment inhibits vGPCR tumor angiogenesis and VEGF production in the tumor and transformed cells.
A) Left panels: Immunoperoxidase staining for CD31/PECAM or SMA was performed on tumor sections. CD31/PECAM and SMA staining images of Celecoxib treated or untreated animals are shown. Right panel: Data of staining intensity levels is represented on box-plots showing the results for the morphometric quantification of CD31/PECAM (left) (*P<0.001) and αSMA (right) (*P<0.01) staining (n = 7). B) Tumor samples for mice tested for tumorigenesis were homogenized and centrifuged. VEGF production was measured in the supernatants by ELISA in Celecoxib treated mice or DMSO controls. The plot shows the mean of each group and the value of individual determinations (black circles) (*P<0.001) (n = 7). C) vGPCR-transformed NIH3T3 cells were cultured for the indicated time and treated (grey bars) or not (black bars) with NS398 (10uM). VEGF production was measured in the supernatants by ELISA. (*P<0.05).

