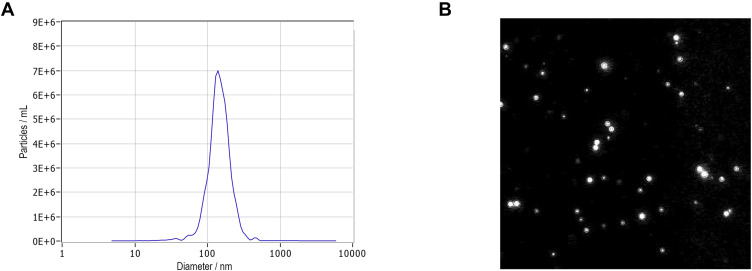
Figure 1.
Characterization of isolated exosomes. (A) Nanoparticle tracking analysis (NTA) of exosomes. The x-axis indicates the size distribution of particles and the y-axis shows the relative counts in NTA. The size distribution of exosomes ranges from approximately 50 nm to 200 nm in diameter with a peak of 140 nm that represents the mode size of exosomes. (B) Video capture of recorded exosome movements.

