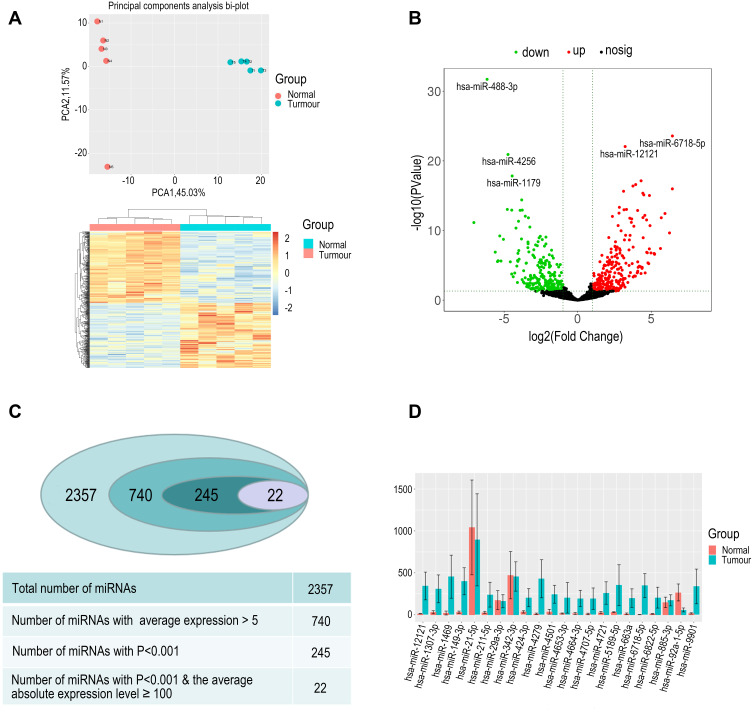
Figure 2.
(A) PCA analysis was performed and the presented variance is analyzed by PC1 and PC2; the results suggest that the two groups have significant difference and clustering effects. Heat map analysis of differential 245 miRNAs (P<0.001, average counts >5, log|FC|>1). (B). Volcano plot of differentially expressed miRNAs in patients with RCC and healthy individuals. Plotted along the x-axis is the mean of the log2 fold-change and the y-axis is the negative logarithm of the -log P‑values. Red points represent significantly upregulated miRNAs, and green points represent significantly downregulated miRNAs with a >2.0‑fold change. (C) The process of miRNA selection. Finally, we screened 22 miRNAs for further analysis. (D) Comparison of the expression of selected miRNAs in RCC and control groups.

