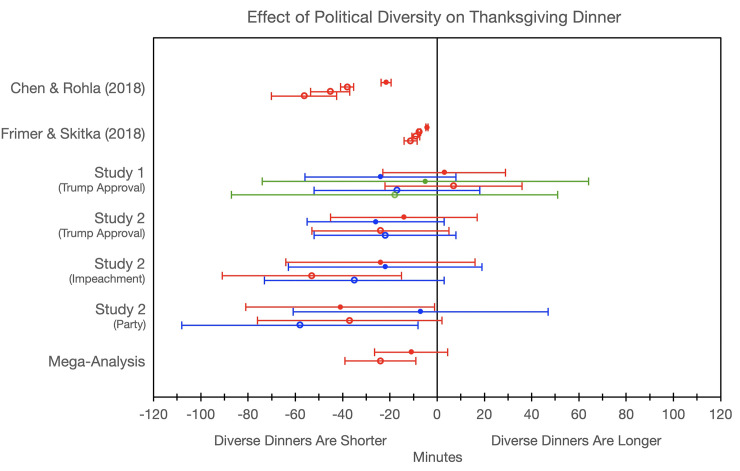
Fig 2. Estimates of the effect of political diversity on Thanksgiving dinner duration in minutes.
Red represent analyses with full samples whereas blue and green represent analyses with participants that were confident about their arrival and departure time within 5 and 1 minutes respectively. Filled dots represent zero-order effects whereas open dots represent conditioned correlations while controlling for various covariates. Operationalizations of diversity are in parentheses. Error bars represent 95% confidence intervals.

