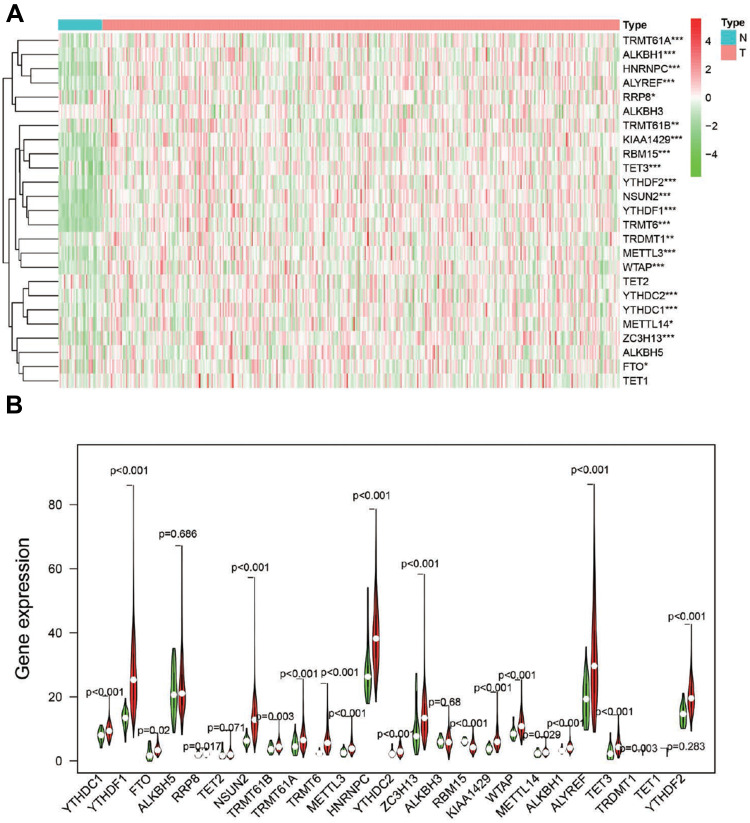
Figure 2.
The expression of RNA methylation regulators in GC. (A). Heatmap showed the expression of the RNA methylation regulators in 375 GC and 32 para-carcinoma tissues; *P<0.05, **P<0.01, ***P<0.001. (B). Vioplot visualized the expression of 25 RNA methylation regulators in different tissue samples in GC and para-carcinoma tissues.

