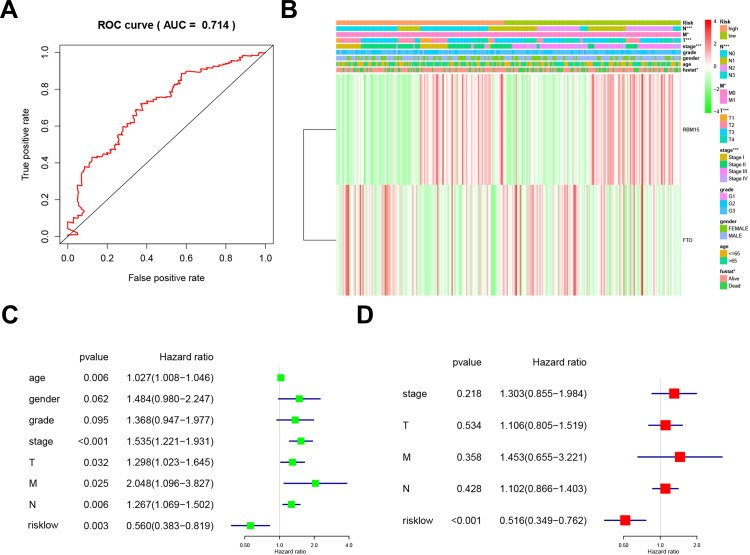
Figure 5.
Relationship between risk prediction model and clinicopathological features and prognostic value. (A). The ROC curve evaluates the predictive efficiency of the risk prediction model. (B). Heatmap showed the expression of two m6A RNA methylation regulators in GC. The distribution of clinicopathological features was compared between high-risk and low-risk groups. (C). Univariate Cox regression analysis of clinicopathological factors and risk score associated with OS. (D). Univariate Cox regression analysis of clinicopathological factors and risk score associated with OS.

