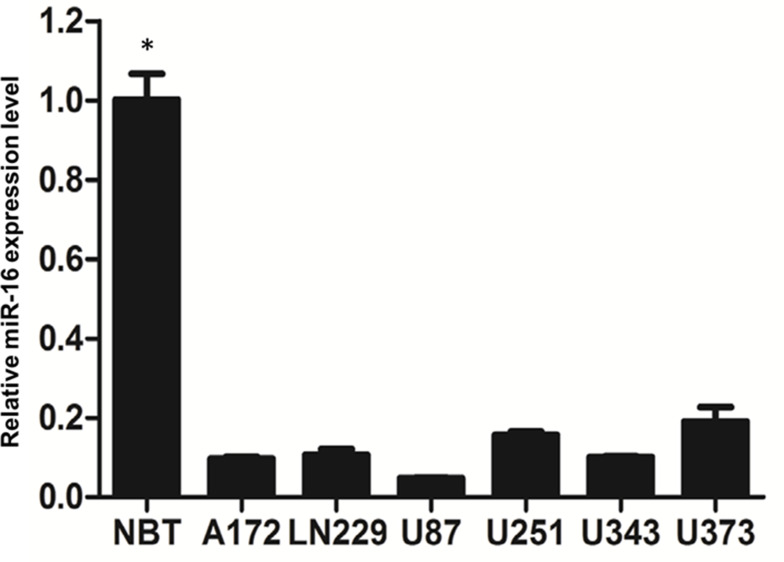
Figure 1.
Expression of miR-16 in normal brain tissues and glioblastoma cell lines was assessed using real-time PCR. Data are represented as expression levels relative to that of normal brain tissues (NBT). *P<0.05 comparing to different glioblastoma cell lines. Shown are the representative data set of three independent experiments.

