
Figure 8.
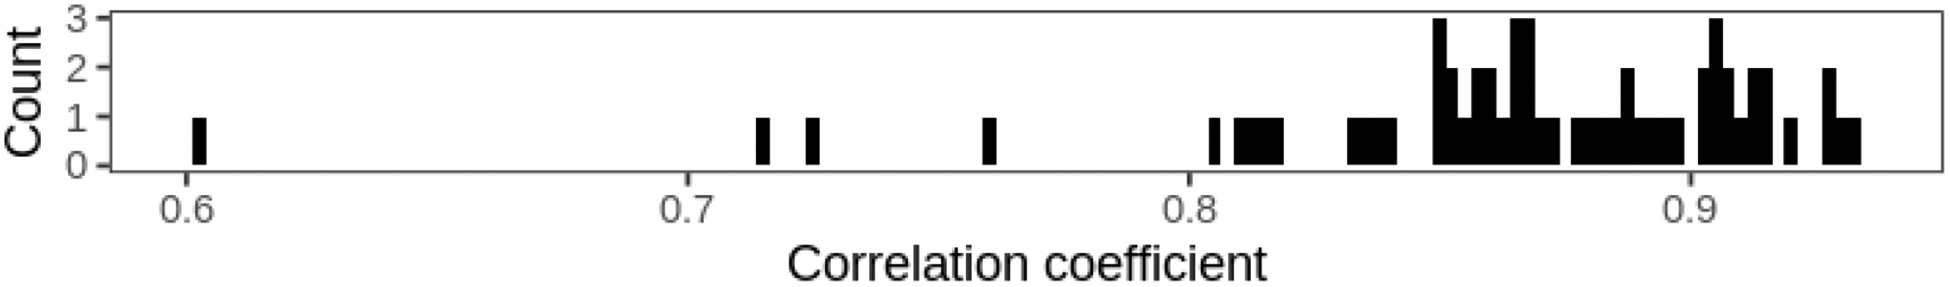
Histogram of the per-site Pearson correlations between non-missing Terra AOD values and corresponding SHAPs for 59 sites with at least 100 non-missing values in 2015.
Official websites use .gov
A
.gov website belongs to an official
government organization in the United States.
Secure .gov websites use HTTPS
A lock (
) or https:// means you've safely
connected to the .gov website. Share sensitive
information only on official, secure websites.
Histogram of the per-site Pearson correlations between non-missing Terra AOD values and corresponding SHAPs for 59 sites with at least 100 non-missing values in 2015.