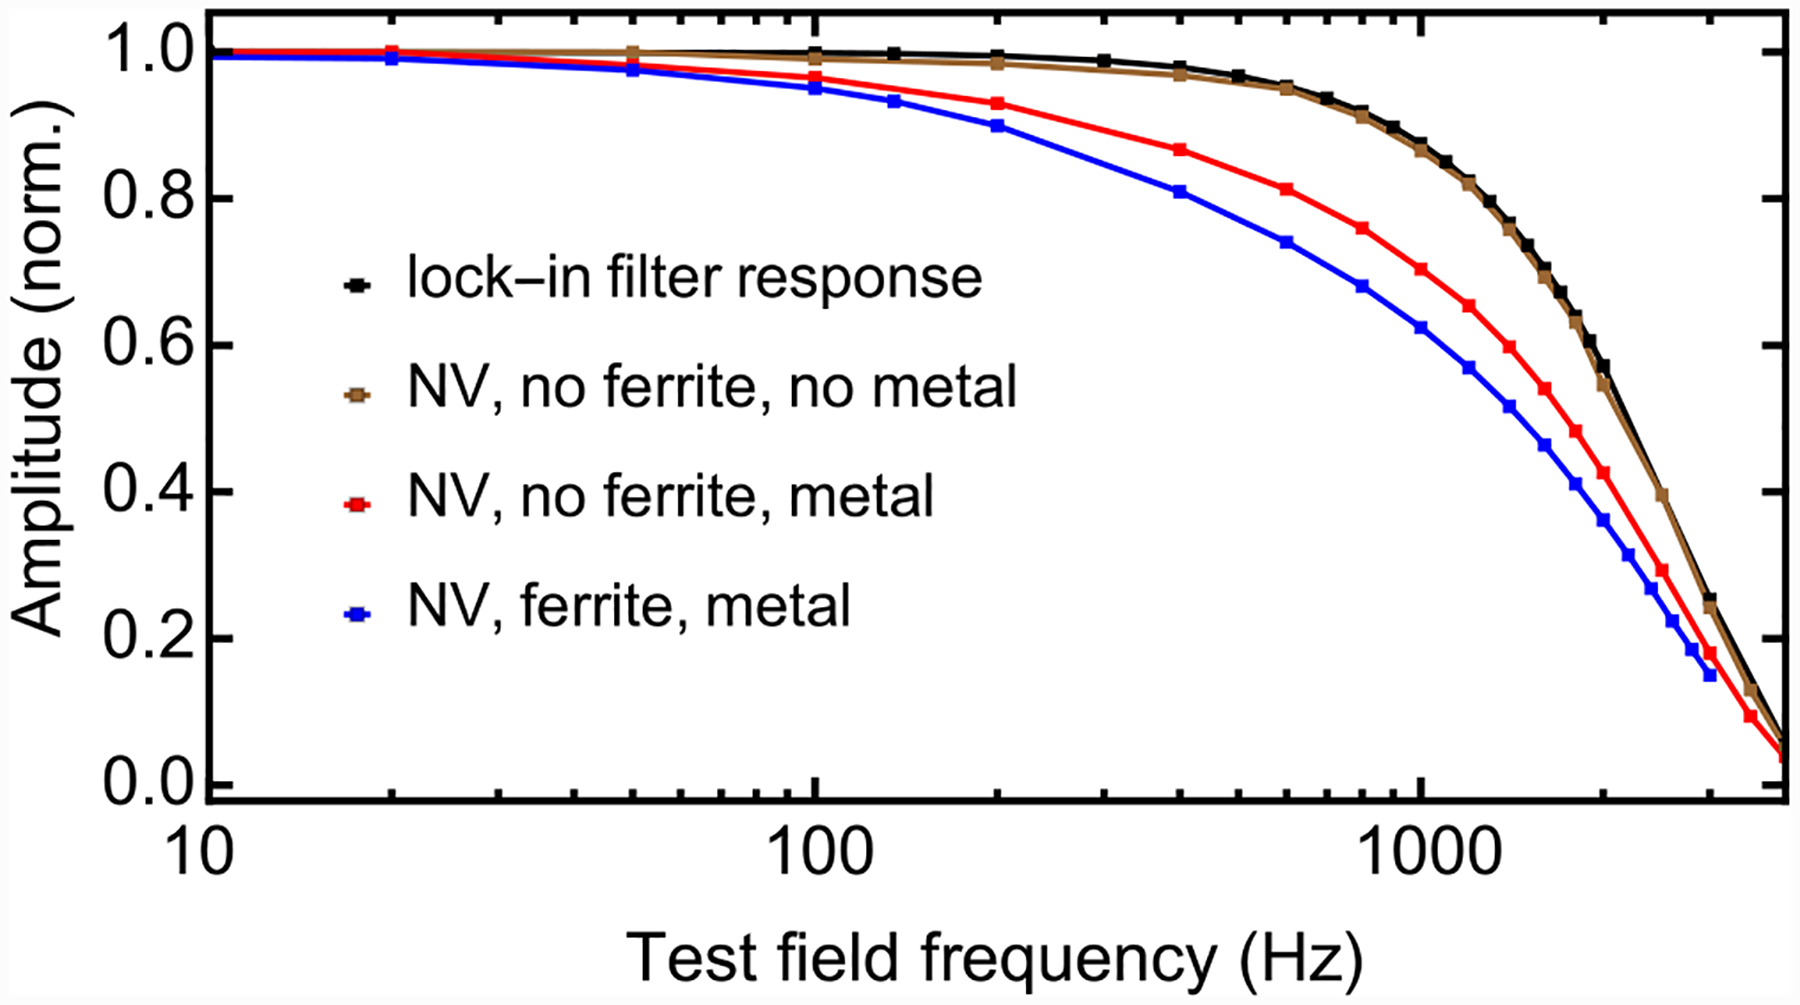
FIG. 11. Frequency response of different magnetometer configurations:

The blue trace is the normalized magnetometer frequency response, reproduced from Fig. 4(c). The red trace is the same NV magnetometer setup except without the ferrite cones. The brown trace is the NV magnetometer without ferrite cones and with metal components (Fig. 12) removed from the interior of the Helmholtz coils. The black trace is the lock-in filter response as measured by amplitude-modulated voltage inputs.
