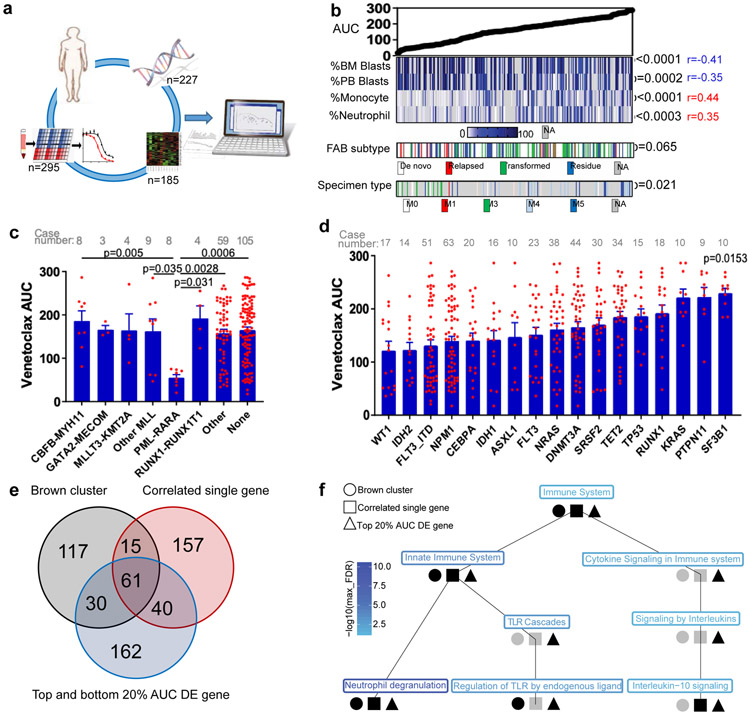
Figure 1. Identification of molecular markers for venetoclax resistance.
a, Schematic of integrating patient clinical, demographic, WES, RNAseq, and venetoclax in vitro screening assay data to identify biomarkers predicting venetoclax response.
b, Venetoclax AUC from primary AML patient samples (N=297 samples) was compared among a multitude of clinical characteristics (Supplementary Table 1). Significance was determined using either two tailed Mann-Whitney or Kruskal-Wallis tests (for categorical variables) or two tailed Pearson correlations (for continuous variables), and corrected for multiple comparisons (Bonferroni correction). The numerical source data have been provided as Source Data_Figure 1b.
c, The graph depict mean ± SEM of venetoclax AUC among different chromosome translocation groups. The presence/absence of translocations was determined from karyotype. Only translocations that were found in ≥3 patients were considered. Significance was determined using a Kruskal-Wallis test. The numerical source data have been provided as Source Data_Figure 1c.
d, The graph depicts mean ± SEM of venetoclax AUCs among common AML mutation groups. Briefly, we compared AUCs from all samples harboring each mutation to AUCs from all other samples WT for that mutation. Mutation data were collected by either targeted sequencing, whole-exome sequencing, or targeted polymerase chain reaction (PCR)-based methods (FLT3-ITD and NPM1). Significance was determined using two tailed Mann-Whitney tests and corrected for multiple comparisons (Bonferroni correction). The numerical source data have been provided as Source Data_Figure 1d.
e, Venn diagrams depict distribution and overlap of the three gene lists: WGCNA brown gene expression cluster, most correlated single genes (single genes correlated with venetoclax AUC with r>=0.5 or r<=0.5 and FDR <0.05), and top 20% DE genes (the most differentially expressed genes between the top 20% and the bottom 20% venetoclax AUC samples) (N=180 samples). For the single-gene correlations, two tailed student's t-tests were used testing whether the slope of the regression line (auc~gene_expression) was different than zero. FDR correction was used for multiple comparison adjustments. For the top 20% and the bottom 20% AUC DE analyses, two tailed student's t-tests were computed testing for significance for the ‘top 20%’ – ‘bottom 20%’ (resistant - sensitive) expression log2 fold changes. The resulting p-values were FDR corrected per inhibitor. We did not perform a familywise error correction. Venn diagrams were generated using an online tool: http://bioinformatics.psb.ugent.be/webtools/Venn/. DE: differentially expressed. The numerical source data have been provided as Source Data_Figure 1e.
f, The graph shown is the Reactome pathway hierarchy containing all pathways significant in at least 1 of the 3 analyses (WGCNA brown gene expression cluster; single genes correlated with venetoclax AUC with r>=0.5 or r<=0.5; and the most DE genes between the top 20% and the bottom 20% AUC samples (N=180 samples)). All pathways were assessed for significance at the FDR <0.05 level based on an over-representation analysis using the hypergeometric distribution and Benjamani-Hochberg adjustment. Black indicates the pathway was significant at FDR <0.05 and grey indicates otherwise. The pathway names are colored by the level of significance with blue being the most significant and light blue being least significant in terms of the maximum of the significant FDR for the three analyses.

