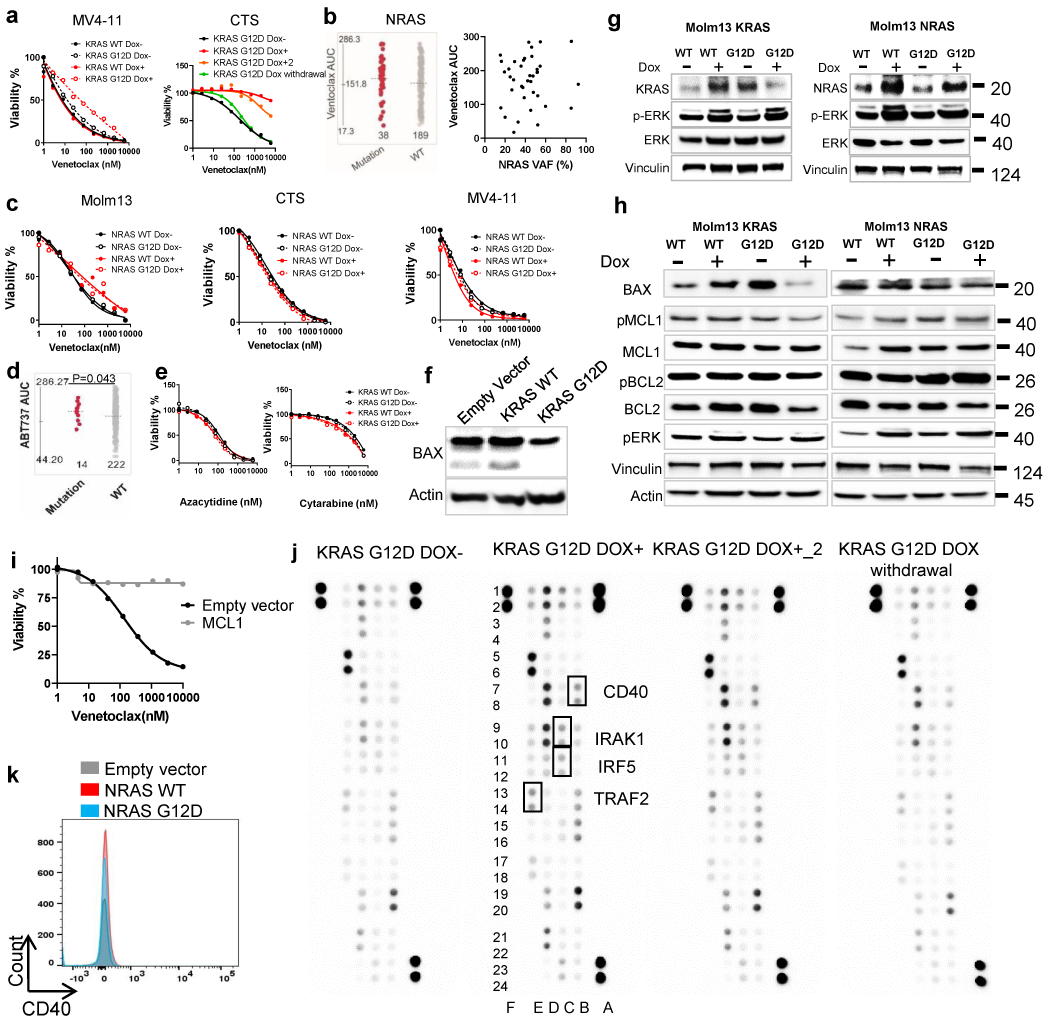
Extended Data Fig. 5. KRAS, but not NRAS mutations confer venetoclax resistance.

a, CTS or MV4-11 cells were transduced with Dox-inducible KRAS WT and G12D virus. KRAS G12D transduced cells were cultured in the presence of Dox (for 2 weeks), in the absence of Dox, and/or after 2 weeks of induction followed by Dox withdrawal for 3 weeks. Representative graphs depict cell viabilities (mean from 3 technical replicates) in the presence of dose gradients of venetoclax. The graph for MV4-11 is representative of two independent experiments with consistent results. For CTS, Dox conditions have two biological independently established replicates, whereas no Dox and Dox withdrawal controls were established once. The numerical source data have been provided as Extended Source Data Extended Data Fig. 5a.
b, The graph (left) demonstrates similar venetoclax AUCs in AML samples with NRAS mutations (N=38 samples) compared with NRAS WT samples (N=189 samples). Significance was determined using two tailed Mann-Whitney tests. P=0.272. The dot plot (right) depicts the correlation between NRAS mutation variant allelic frequency (VAF) and venetoclax AUC determined by two tailed Pearson correlation (N=38). No significant correlation was observed.
c, Representative graphs depict similar cell viabilities (mean from 3 technical replicates) of NRAS WT or G12D transduced cells in the presence of dose gradients of venetoclax. The graph is representative of two independent experiments with consistent results. The numerical source data have been provided as Extended Source Data_Extended Data Fig. 5c
d, The graph demonstrates higher ABT-737 AUCs in AML samples with KRAS mutations (N=14 samples) compared with KRAS WT samples (N=222). Significance was determined using two tailed Mann-Whitney tests.
e, Representative graphs depict similar cell viabilities (mean from 3 technical replicates) of KRAS WT or G12D transduced cells in the presence of dose gradients of Azacytidine or Cytarabine. The graph is representative of two independent experiments with consistent results. The numerical source data have been provided as Extended Source Data_Extended Data Fig. 5e.
f, Molm13 cells were transduced with lentiviral vectors encoding an empty, KRAS WT, or KRAS G12D construct constitutively. Western blot analyses show decreased BAX in KRAS G12D cells. Blots are representative of two independent experiments with consistent results.
g, Western blot analyses showing pERK activation in NRAS or KRAS WT and mutant transduced cells. Blots are representative of two independent experiments with consistent results. The image source data have been provided as Source Data Extended Data Fig. 5.
h, Western blot analyses showing decreased BAX and BCL2 in KRAS mutant, but not KRAS WT, NRAS WT, or NRAS mutant transduced cells. Blots are representative of two independent experiments with consistent results.
i, The graph depicts cell viabilities (mean from 3 technical replicates) of Molm13 cells expressing MCL1 or an empty control vector in the presence of dose gradients of venetoclax. The graphs are representative of two independent experiments with consistent results. The numerical source data have been provided as Extended Source Data_Extended Data Fig. 5i
j, The inducible KRAS G12D transduced cells were cultured in the presence of Dox (for 2 weeks), in the absence of Dox, or after 2 weeks of induction followed by Dox withdrawal for three weeks. Cell lysates were extracted and subjected to an NFkB pathway proteome array according to the manufacturer’s instructions. Immunoblot depicts 41 human proteins and 4 serine or tyrosine phosphorylation sites in duplicate. For CTS, Dox conditions have two biological independently established replicates, whereas no Dox and Dox withdrawal controls were established once. The image source data have been provided as Source Data Extended Data Fig. 5.
k, Representative flow cytometry overlayed histograms showing no change of CD40 expression in NRAS WT and G12D cells. The graph is representative of two independent experiments with consistent results.
