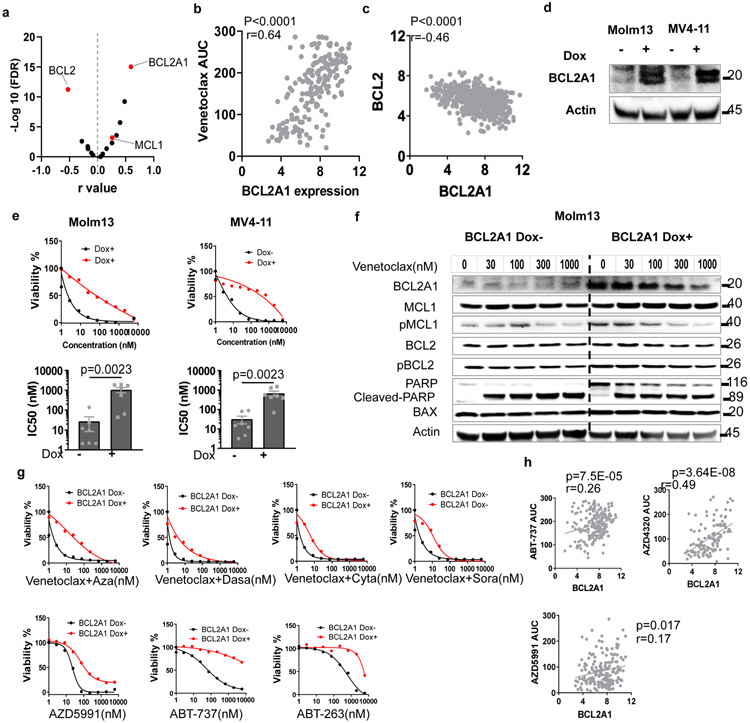
Figure 2. Overexpression of BCL2A1 confers resistance to BCL2 family inhibitors and venetoclax combinations.
a, Data represent −log10(FDR) values vs. the Pearson r values between venetoclax AUC and BCL2 family gene expression levels from 180 AML patient samples, determined by the two tailed Pearson correlation coefficients. Two tailed student's t-tests were used testing whether the slope of the regression line (auc~gene_expression) was different than zero and adjusted for multiple comparisons using FDR correction. The numerical source data have been provided as Source Data_Figure 2a.
b, Correlation between BCL2A1 gene expression levels and venetoclax AUC (N=180 samples) from Beat AML patient samples determined by a two tailed Pearson correlation coefficient. The numerical source data have been provided as Source Data_Figure 2b.
c, Correlation between BCL2A1 and BCL2 gene expression levels from Beat AML patient samples (N=601 samples) determined by a two tailed Pearson correlation coefficient. The numerical source data have been provided as Source Data_Figure 2c.
d, Western blot showing overexpression of BCL2A1 from Molm13 and MV4-11 cells transduced with Dox-inducible BCL2A1 virus in the presence of Dox. Actin was used as a control. The blot shown is representative of two independent experiments with consistent results. The image source data have been provided as Source Data Fig. 2.
e, Representative graphs depict higher viabilities (mean from 3 technical replicates) of Molm13 and MV4-11 cells transduced with Dox-inducible BCL2A1 virus in the presence of Dox and dose gradients of venetoclax (top). Bar graphs depict higher mean ± SEM of venetoclax IC50 (N=7 independently repeated experiments) of Molm13 and MV4-11 cells transduced with Dox-inducible BCL2A1 virus in the presence of Dox (bottom). Significance was determined using two tailed Mann-Whitney tests.
f, Western blot analysis of BCL2 family proteins and full-length/cleaved PARP of Molm13 cells transduced with Dox-inducible BCL2A1 virus in the absence or presence of Dox and dose gradients of venetoclax for 16 hours (h). Actin was used as a control. Blots shown are representative of two independent experiments with consistent results. The image source data have been provided as Source Data Fig. 5.
g, Graphs depict the viabilities (mean from 3 technical replicates) of Molm13 and MV4-11 cells transduced with Dox-inducible BCL2A1 virus in the absence or presence of Dox and indicated venetoclax combination and other BCL2 inhibitors. Graphs shown are representative of two independent experiments. Aza: azacytadine; Dasa: dasatinib; Cyta: cytarabine; and Sora: sorafenib. The numerical source data have been provided as Source Data_Figure 2g.
h, Graphs depict the correlation between BCL2A1 gene expression levels ABT-737 (N=209 samples), AZD4320 (N=119 samples), or AZD5991 from AML patient samples (N=178 samples) determined by two tailed Pearson correlation coefficient tests. The numerical source data have been provided as Source Data_Figure 2h.

