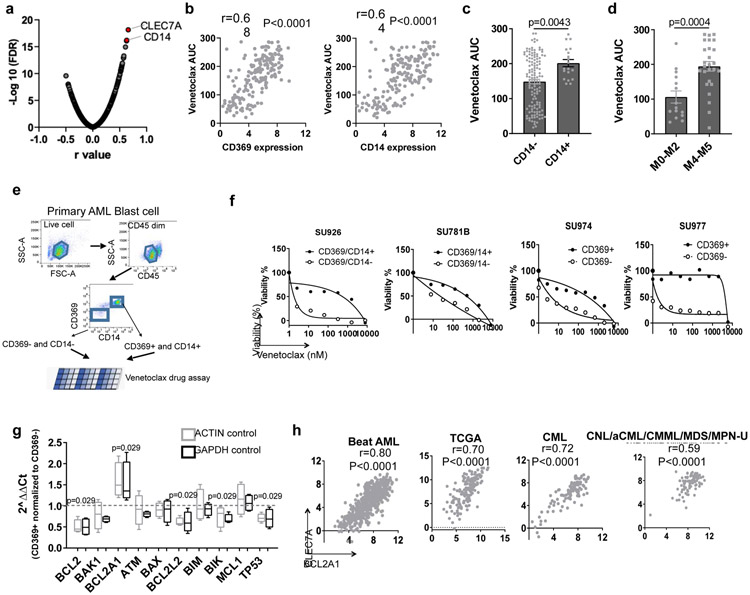
Figure 4. Expression of CLEC7A or CD14 predicts venetoclax sensitivity.
a, Data represent −log10(FDR) values vs. the Pearson r values between venetoclax AUC and gene expression levels of cell surface GO term genes from 180 AML patient samples, determined by a two tailed Pearson correlation coefficient test. The list of cell surface proteins is provided as Source Data_Figure 4a.
b, Correlation between CLEC7A and CD14 gene expression levels and venetoclax AUC (N=180 samples) from AML patient samples determined by two tailed Pearson correlation coefficient tests.
c, The graph depicts the mean ± SEM of venetoclax AUCs of primary AML patient samples categorized based on the presence (N=19 samples) or absence of CD14 (N=131 samples) expression detected by clinical flow cytometry. Significance was determined using a two tailed Mann-Whitney test.
d, The graph depicts the mean ± SEM of venetoclax AUCs of primary AML patient samples in the non-M4/M5 (N=15 samples) and M4/M5 (N=26 samples) groups for those samples with clinical annotation. Significance was determined using a two tailed Mann-Whitney test.
e, Schematic diagram of isolating CD369 and/or CD14 positive and negative primary AML blasts and performing venetoclax sensitivity assay.
f, Graphs depict cell viabilities (mean from 3 technical replicates) of CD369/CD14+ or CD369/CD14− primary leukemia blast cells in the presence of dose gradients of venetoclax from 4 different leukemia patients’ samples. The numerical source data have been provided as Source Data_Figure 4f.
g, The box plot depicts the 5-95 percentile of 2^ΔΔCt of indicated apoptosis-related genes between CD369 and/or CD14 positive and negative primary AML blasts (N=4 biologically independent experiments). ACTIN and GAPDH were used as controls. Significance was determined using two tailed Mann-Whitney tests. The numerical source data have been provided as Source Data_Figure 4g.
h, Graphs depict positive correlations between CLEC7A and BCL2A1 gene expression of primary patient samples from the Beat AML (N=601 samples), TCGA AML (N=173 samples), CML (N=102 samples), and CNL/aCML/CMML/MDS/MPN-U (N=94 samples) cohorts determined by two tailed Pearson correlation coefficient tests. The numerical source data have been provided as Source Data_Figure 4h.

