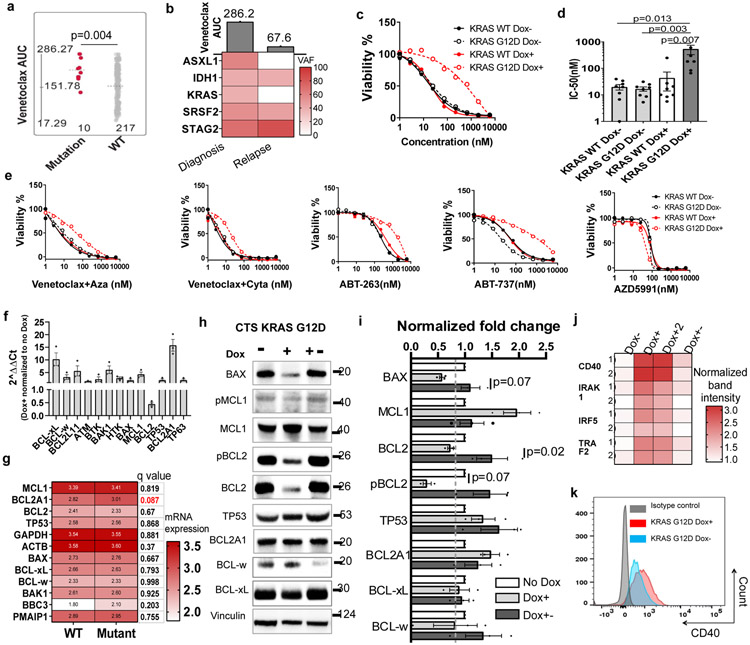
Figure 5. KRAS mutations confer venetoclax resistance.
a, The graph demonstrates higher venetoclax AUCs in AML samples harboring KRAS mutations (N=10 samples) compared to samples without KRAS mutations (N=217 samples). Significance was determined using a two tailed Mann-Whitney test. Slashed line indicates the mean of the group.
b, The graph summarizes the change of mutation VAF and venetoclax AUC from an AML patient at diagnosis and disease relapse.
c, Representative graphs depict cell viabilities (mean from 3 technical replicates) of Molm13 transduced with Dox-inducible KRAS WT and G12D virus in the absence or presence of Dox and dose gradients of venetoclax. The experiment was performed 8 times independently with consistent results. The numerical source data have been provided as Source Data_Figure 5c.
d, The graph depicts the mean ± SEM of IC50 (N=8 biological independently repeated experiments) of Molm13 cells expressing Dox-inducible KRAS WT and G12D virus in the absence or presence of Dox. Significance was determined using a Kruskal-Wallis test. The numerical source data have been provided as Source Data_Figure 5d.
e, Graphs depict cell viabilities (mean from 3 technical replicates) of Molm13 transduced with Dox-inducible KRAS WT and G12D virus in the absence or presence of Dox and dose gradients of venetoclax combinations and other BCL2 family inhibitors. The graph is representative of two independent experiments. Aza: azacytidine; Cyta: cytarabine. The numerical source data have been provided as Source Data_Figure 5e.
f, Graphs depict 2^ ΔΔCt of indicated apoptosis-related genes of KRAS G12D expressing cells in the presence of Dox normalized to cells cultured in the absence of Dox (N=4 independent experiments). HPRT was used as a control. Significance was determined using two tailed Mann-Whitney tests. The numerical source data have been provided as Source Data_Figure 5f.
g, The graph depicts the mean log2 expression of the listed gene in samples in KRAS mutant (N=25 samples) and WT (N=597 samples) group. RNAseq analysis from the BeatAML cohort exported from cBioPortal (https://www.cbioportal.org/). Two tailed student's t-tests were performed and corrected Benjamini-Hochberg procedure. Please find more information at cBioPortal website.
h, Western blot analyses of BCL2 family proteins extracted from Molm13 cells transduced with Dox-inducible KRAS G12D virus in the absence of Dox, presence of Dox, or after Dox withdrawal for more than 3 weeks. The graph is representative of three independent experiments with similar results. The image source data have been provided as Source Data Fig. 5.
i, The graph depicts the mean ± SEM of western blot band intensities quantified using ImageJ software. The bar graph depicts normalized fold changes of the band intensity of BCL2 family proteins extracted from inducible KRAS G12D expressing cells in the presence of Dox normalized to cells cultured without Dox. Significance was determined using two tailed Mann-Whitney tests from three independent experiments.
j, The graph summarizes the dot intensities from the NFkB pathway proteome array blot quantified using ImageJ Figi software. Each antibody is spotted in duplicate. Dox conditions have two biological independently established replicates. No Dox and Dox withdrawal controls were established once. Image source data have been provided as Extended Data Fig. 5j.
k, Representative flow cytometry overlayed histograms showing increased CD40 expression in KRAS G12D cells in the presence of Dox. The graph is representative of two independent experiments with consistent results.

