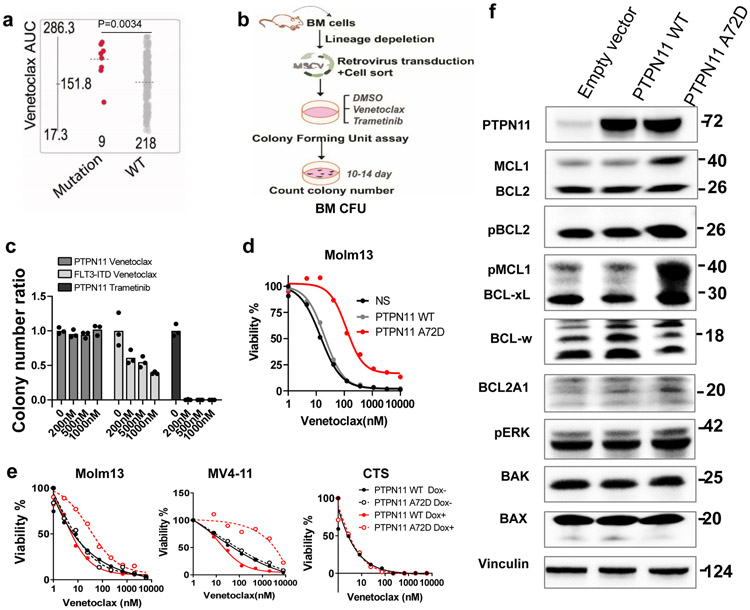
Figure 6. PTPN11 mutations confer venetoclax resistance.
a, The graph demonstrates higher venetoclax AUCs in AML samples with PTPN11 mutations (N=9 samples) compared with PTPN11 WT samples (N=218 samples). Significance was determined using a two tailed Mann-Whitney test. The slashed line indicates the mean of the group.
b, Schematic illustrates BM CFU assay.
c, The graph depicts the normalized colony number ratios (N=3 technical cell culture replicates) of PTPN11 A72D transduced BM HSPCs treated with gradient concentrations of venetoclax or trametinib. The graph is representative of two independent experiments with similar results. The numerical source data have been provided as Source Data_Figure 6c.
d, Representative graphs depict viabilities (mean from 3 technical replicates) of Molm13 transduced with lentivirus encoding an empty vector, PTPN11 WT, or A72D constitutively. The graph is representative of two independent experiments with consistent results. The numerical source data have been provided as Source Data_Figure 6d.
e, Representative graphs depict cell viabilities (mean from 3 technical replicates) of Molm13, MV4-11, and CTS cells transduced with Dox-inducible PTPN11 WT and A72D virus in the absence or presence of Dox and dose gradients of venetoclax. The graph is representative of two independent experiments. The numerical source data have been provided as Source Data_Figure 6e.
f, Western blot analyses of BCL2 family proteins extracted from Molm13 cells expressing an empty vector, PTPN11 WT, or PTPN11 A72D constitutively. Actin was used as a control. Blots are representative of three independent experiments. The image source data have been provided as Source Data Fig. 6.

