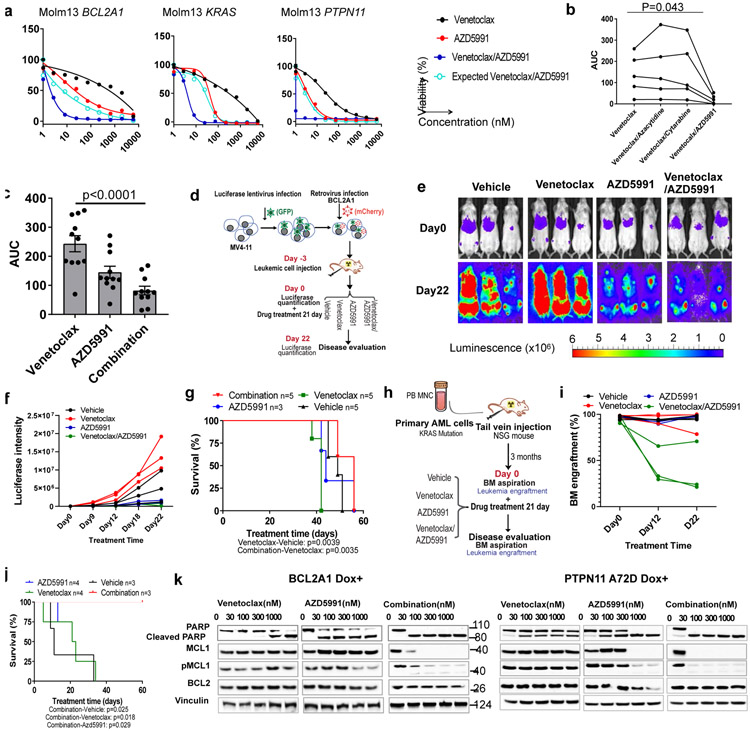
Figure 7. Venetoclax and AZD5991 in combination treatment overcomes venetoclax resistance.
a, Graphs depict cell viabilities (mean from 3 technical replicates) of BCL2A1, KRAS G12D, and PTPN11 A72D transduced cells treated with indicated inhibitors in the presence of Dox. EOB was used to calculate the expected effect of the combination. The graphs are representative of two independent experiments with similar results. EOB; Excess over Bliss. The numerical source data have been provided as Source Data_ Figure 7a_Extended data Fig.7a
b, The graph depicts the AUCs of the indicated drug from 5 primary AML samples. Available samples were used from adult patients with myeloid malignancies from both genders and all age groups. Significance was assessed using a matched one way ANOVA (Friedman test). The numerical source data have been provided as Source Data_ Figure 7b_Extended Data Fig.7b.
c, The graph depicts the mean ± SEM of drug AUCs of venetoclax, AZD5991, and two drugs in combination from 10 primary AML samples. Available samples were used from adult patients with myeloid malignancies from both genders and all age groups. Significance was assessed using a two tailed Kruskal-Wallis test.
d, Schematic illustrates the in vivo model of BCL2A1 mediated venetoclax resistance (MV4-11 cells overexpressing BCL2A1).
e, Serial bioluminescence images of MV4-11 BCL2A1 overexpression-engrafted NSG mice during treatment. The experiment was performed once.
f, The graph depicts luciferase intensity (average radiance (p/s/cm2/sr), N=3 mice) of MV4-11 cells expressing BCL2A1 in the presence of indicated treatment. The experiment was performed once. The numerical source data have been provided as Source Data_Figure 7f.
g, Survival curves of 7-week old female NSG mice transplanted with BCL2A1 and luciferase-GFP treated with indicated drugs. The experiment was performed once. The numerical source data have been provided as Source Data_Figure 7g.
h, Schematic outline of the mouse model of KRAS mutation mediated venetoclax resistance (primary AML cell).
i, The graph depicts BM engraftment (N=3 mice) of SU176 patient AML cells in 7-week old female NSG mice before and during treatment. The experiment was performed once. The numerical source data have been provided as Source Data_Figure 7i.
j, Survival curves of mice transplanted with blasts from SU176 leukemia sample harboring a KRAS G12D mutation treated with indicated drugs. N refers to the number of mice. The numerical source data have been provided as Source Data_Figure 7j.
k, Western blot analyses of BCL2 family proteins of Molm13 cells expressing BCL2A1 (left) and PTPN11 A72D (right) in the presence of Dox-treated with dose gradients of venetoclax, AZD5991, and the two drugs in combination for 16h. Blots are representative of two independent experiments. The image source data have been provided as Source Data Fig. 7.

