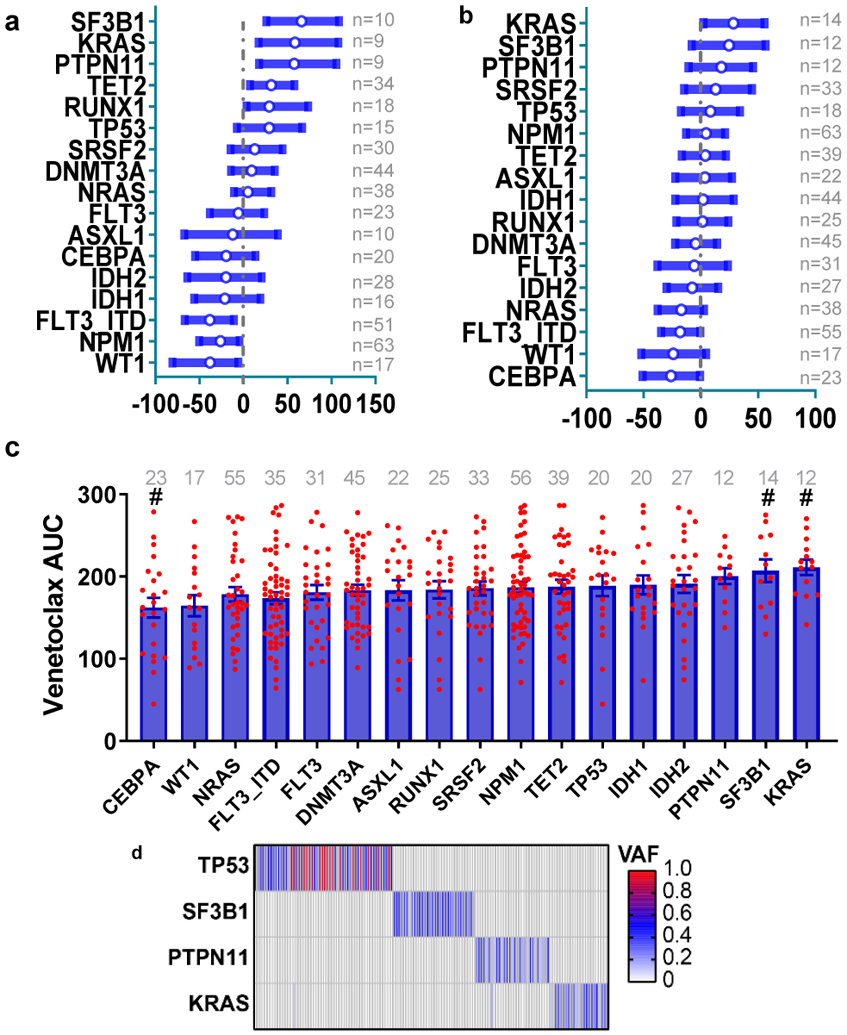
Extended Data Fig. 1. Factors influencing venetoclax and ABT-737 response.

a, The graph depicts the 95% CI and Hodges-Lehmann median difference of venetoclax AUC in the presence or absence of mutations in the indicated gene calculated using two tailed Mann-Whitney tests. The case numbers are listed on the right side.
b, The graph depicts the 95% CI and Hodges-Lehmann median difference of ABT-737 AUC in the presence or absence of mutations in the indicated gene calculated using two tailed Mann-Whitney tests.
c, The ABT-737 AUC was compared among different common AML mutation groups. Briefly, we compared AUCs from all samples harboring each mutation to AUCs from all other samples WT for that mutation. Significance was determined using two tailed Kruskal-Wallis tests, and corrected for multiple comparisons (Bonferroni correction), and expressed as #<0.05 before Bonferroni correction. The case numbers are listed on the top.
d, The heatmap depicts distributions of TP53 (N=54 positive samples), SF3B1 (N=32 positive samples), PTPN11 (N=29 positive samples), and KRAS (N=26 positive samples) mutations in the Beat AML cohort (total N=622 samples). Each column displays each patient; each row denotes a specific gene. The mutation variant allelic frequency (VAF) is colored.
