. 2020 Sep 23;9:e57779. doi: 10.7554/eLife.57779

Figure 1. Single-cell (sc) RNA-seq of hindbrain neural crest reveals known and novel transcriptional regulators.

(A) Schematic diagram illustrating the pipeline for performing scRNA-seq on the 10X Genomics platform. Reporter expression mediated by the FoxD3-NC2 enhancer (A’) was used as reference to dissect the hindbrain of HH12 chick embryos. Barcoded GEMs generated from the single-cell suspension were sequenced at a median depth of 50,000 reads/cell. (B) Dimensional reduction using UMAP identifies six subpopulations (including the spike-in) contained within the dissociated embryonic hindbrain. (C) Subset of B showing cells from hindbrain (Hb), ectoderm (Ect), and neural crest (NC). (D–D’) Feature plots used to visualize the expression of known marker genes as a means of identifying subpopulations in (C) in low-dimensional space. Single-cell expression distribution for marker genes (D’) in each cluster is shown as violin plots. (E) Genes that were associated with the GO terms ‘DNA binding’, ‘regulation of transcription,’ or ‘transcription factor’ were characterized as transcriptional regulators and the relative expression and abundance of a subset of them was visualized as a dot plot. The size of each dot corresponds to the percentage of cells expressing that specific gene in a given cluster, while the color represents the average expression level. (F) Feature plots showing expression of previously uncharacterized transcription factors or chromatin remodelers expressed in neural crest cells. (G–K) Hybridization chain reaction was used to validate the expression of a few factors that were identified in (E). Dorsal view of the hindbrain of HH12 shows migratory neural crest streams at r4 and r6 surrounding the otic. Hb, hindbrain; ot, otic placode; r, rhombomere; nc, neural crest; ect, ectoderm. See also Figure 1—figure supplements 1 and 2.

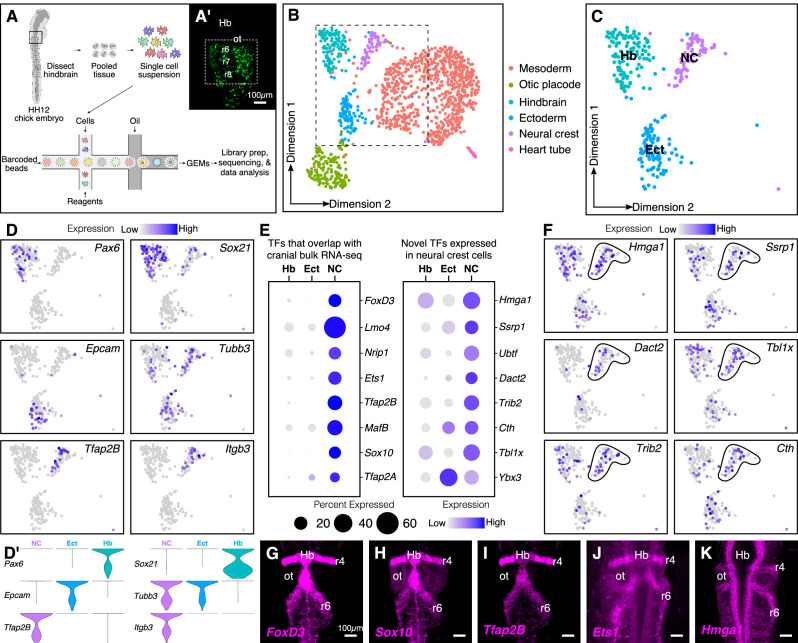
Figure 1.

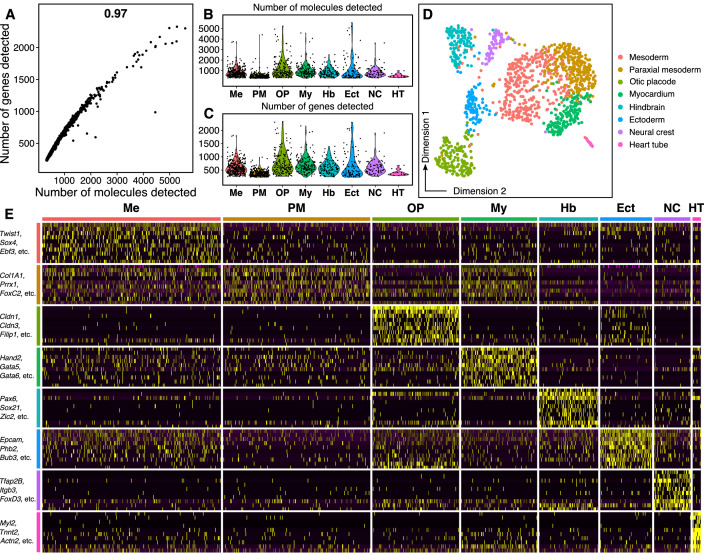
Figure 1—figure supplement 1. Quality of single-cell RNA-seq dataset.

Figure 1—figure supplement 1.

(A) Scatter plot shows high correlation between the number of unique genes and the total number of molecules detected in each cell. (B–C) The distribution of total number of molecules (B) and number of unique genes (C) detected per cell across the eight cell types identified within the chick hindbrain. (D) Increasing the resolution parameter in the single-cell analysis pipeline to calculate a cell’s ‘nearest neighbor’ allowed identification of three subpopulations within the ‘mesoderm’ cluster displayed in Figure 1B. Based on marker gene expression, these subpopulations were identified as mesoderm (Twist1+), paraxial mesoderm (Prrx1+), and myocardium (Hand2+). (E) The expression of the top 10 most abundant genes from each subcluster was used to plot a heatmap, which also grouped into eight distinct categories, similar to (D). A subset of these abundant genes are labeled along the y-axis.
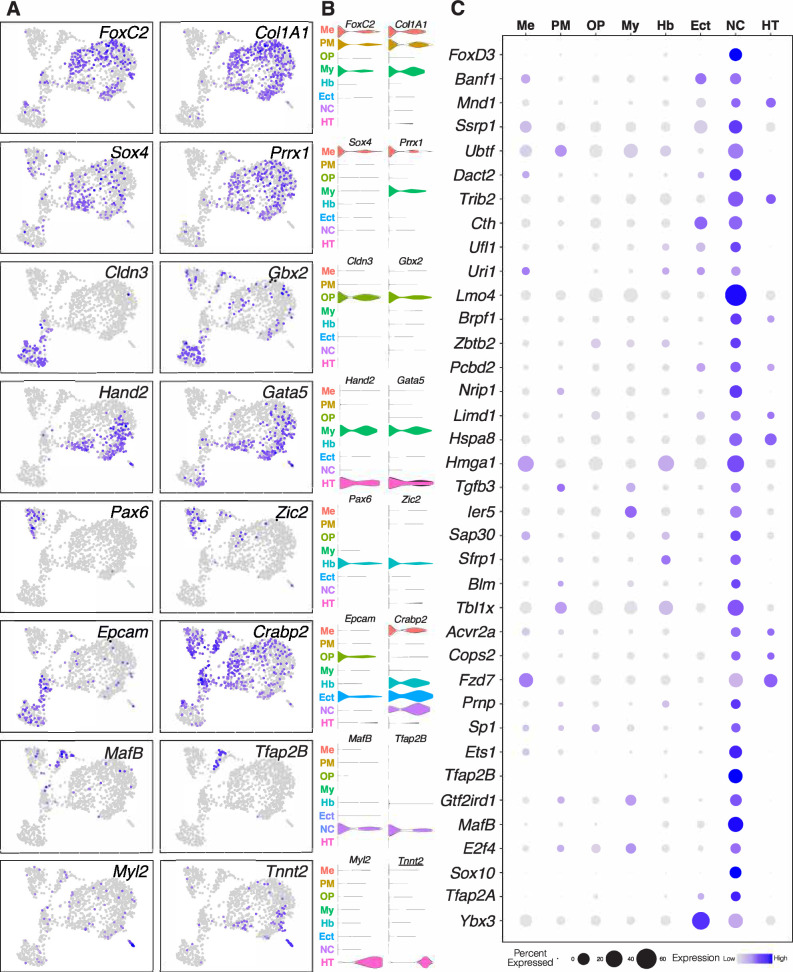
Figure 1—figure supplement 2. Identification of novel genes expressed in the neural crest.

Figure 1—figure supplement 2.

(A) Feature plots showing expression of marker genes in low-dimensional space used to identify all eight sub-clusters within the chick hindbrain. (B) Violin plots showing the distribution of expression of these marker genes (A) in surrounding cell types. (C) Relative expression of all genes expressed in the neural crest cluster that share the GO terms ‘DNA binding’, ‘transcription factor’, and ‘regulation of transcription’. Several of these genes are transcriptional regulators and/or chromatin remodelers that are ubiquitously expressed in surrounding tissues. The radius of each point reflects the proportion of cells within individual clusters that express a specific gene, whereas the relative expression is reflected by the color of the point (grey – low/negative expression, blue – high expression). A subset of these genes are highlighted in Figure 1E.