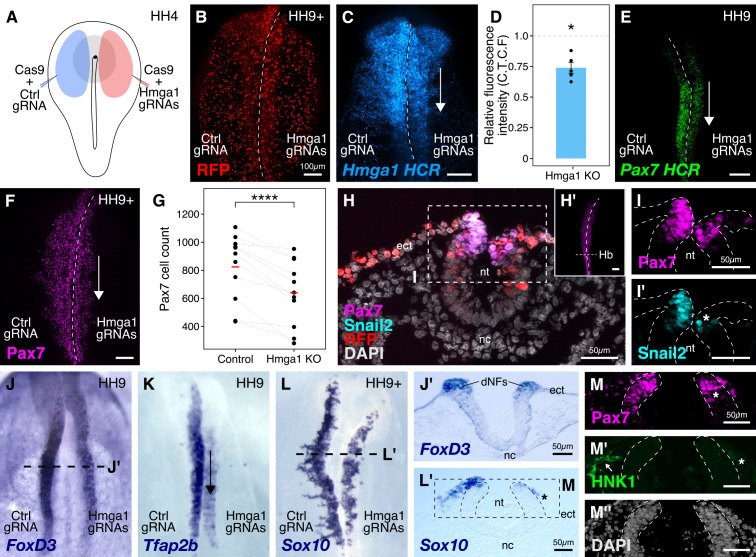
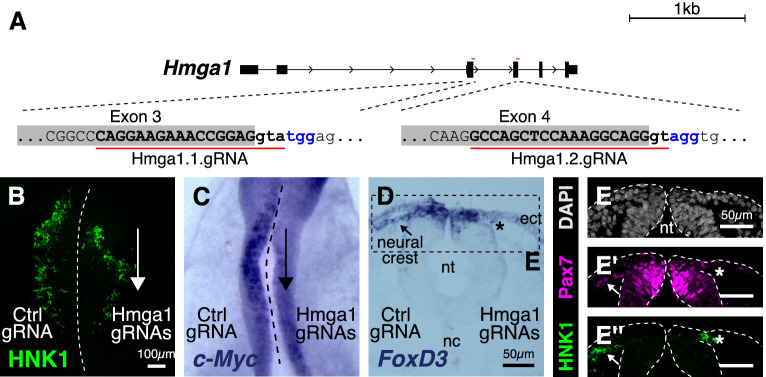
Figure 3. Hmga1 knockout results in loss of neural crest specification.
(A) The electroporation strategy for knocking out Hmga1 using CRISPR-Cas9 in gastrula stage chick embryos. (B) Electroporated embryos were allowed to develop until HH9+ and screened for the expression of H2B-RFP. (C) Electroporation of Cas9 and Hmga1 gRNAs on the right side resulted in loss of Hmga1 transcripts in the neural crest as confirmed using HCR. (D) Hmga1 expression in the neural crest quantified as corrected total cell fluorescence (CTCF) intensity in wholemount Hmga1-mutant embryos processed for HCR. A significant reduction in expression was observed (p-value<0.05, Wilcoxon rank test) on the experimental compared to the control side. A ratio of 1 (dotted line) corresponds to similar levels of Hmga1 expression on both sides. (E–F) Hmga1 knockout results in reduced Pax7 expression in the neural crest, likely resulting from a significant reduction in Pax7+ cell count (F) on the knockout compared to the control side (****p<0.0001, student’s t-test). (G–H) Transverse section through the hindbrain of a representative knockout embryo (G’) was stained for Pax7 (H) and the neural crest specifier Snail2 (H’). (I) Hmga1 knockout also resulted in a reduction of Pax7 transcripts on the knockout side. (J–L) Hmga1-mutant embryos were processed for in situ hybridization against neural crest specifier genes FoxD3 (J, J’), Tfap2b (K), and Sox10 (L, L’). (M) Transverse section through a representative embryo probed for the expression of Sox10 showed reduced expression of the migratory neural crest marker, HNK1. The expression of Pax7 (M’) was also reduced, while the thickness of the neural tube remained unchanged (M’’). See also Figure 3—figure supplement 1; Figure 3—source data 1, Figure 3—source data 2.


