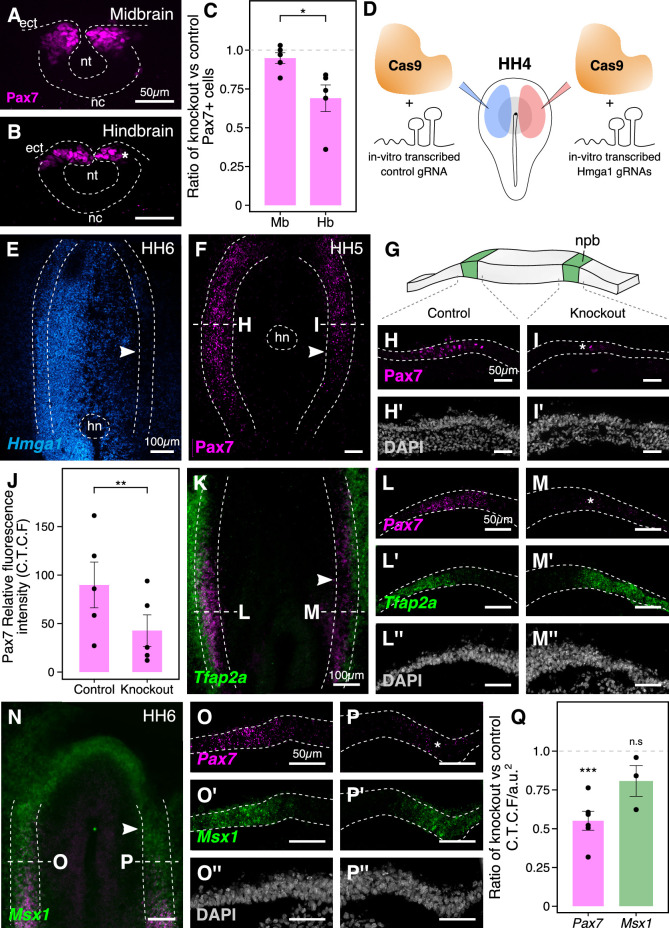
Figure 4. The effects of Hmga1 knockout on neural crest specification are Pax7-dependent.
(A-B) Transverse sections through a representative embryo show a dramatic reduction in the number of Pax7+ cells in the hindbrain (B, asterisk) as compared to the midbrain (A) at HH9/9+. As the hindbrain develops later than the midbrain due to the anterior-posterior progression of neural development, the effect on neural crest specification is more penetrant in the hindbrain (asterisk) due to the time lag between Cas9 plasmid electroporation and its activation in transfected cells. (C) The ratio of Pax7+ cells between the experimental and control sides quantified at the midbrain and hindbrain levels is significantly different (*p<0.05; student’s t-test). A ratio of 1 (dotted line) corresponds to a similar number of Pax7+ cells on both sides. (D) Electroporation strategy for knocking out Hmga1 using Cas9 protein and in vitro-transcribed gRNAs. This strategy was used to immediately reduce the levels of Hmga1 on the knockout side. (E) HCR against Hmga1 in mutant embryos shows dramatic transcriptional reduction on the experimental side (arrowhead). (F) Cas9-protein-mediated loss of Hmga1 resulted in downregulation of Pax7 expression in the neural plate border on the right side (experimental side; arrowhead). (G) Illustration of the neural plate border. (H–I’) Transverse section through embryo shown in F. Electroporation of the control ribonucleoprotein (RNP) complex had no effect on the expression of Pax7 in the neural plate border (H), whereas the knockout side showed an almost complete loss (I, asterisk). No difference in the thickness of the neural plate border was observed between the two sides (H’,I’). (J) Quantification of relative fluorescence intensity for Pax7 signal calculated as corrected total cell fluorescence (C.T.C.F) revealed a statistically significant difference between the control (left) and knockout (right) sides (**p<0.01, paired student’s t-test). (K–P’’) Representative Hmga1-mutant embryos that were processed for HCR against neural plate border genes Tfap2a (K; experimental side - arrowhead) and Msx1 (N; experimental side - arrowhead). While Hmga1 loss resulted in reduction of Pax7 transcripts on the experimental sides (M,P; asterisk) compared to the control sides (L,O), the expression of Tfap2a (L’,M’) and Msx1 (O’,P’) was relatively unchanged. No notable difference was observed in the thickness of the neural plate border (L’’,M’’,O’’,P’’). (Q) Transcriptional response to the loss of Hmga1 was quantified as the ratio of knockout versus control C.T.C.F per unit area. While Pax7 expression was significantly reduced (***p<0.001, paired student’s t-test), no significant difference in Msx1 expression was observed (n.s. p>0.05, paired student’s t-test). Dotted line represents unperturbed ratio. See also Figure 4—figure supplement 1; Figure 4—source data 1, Figure 4—source data 2, Figure 4—source data 3.


