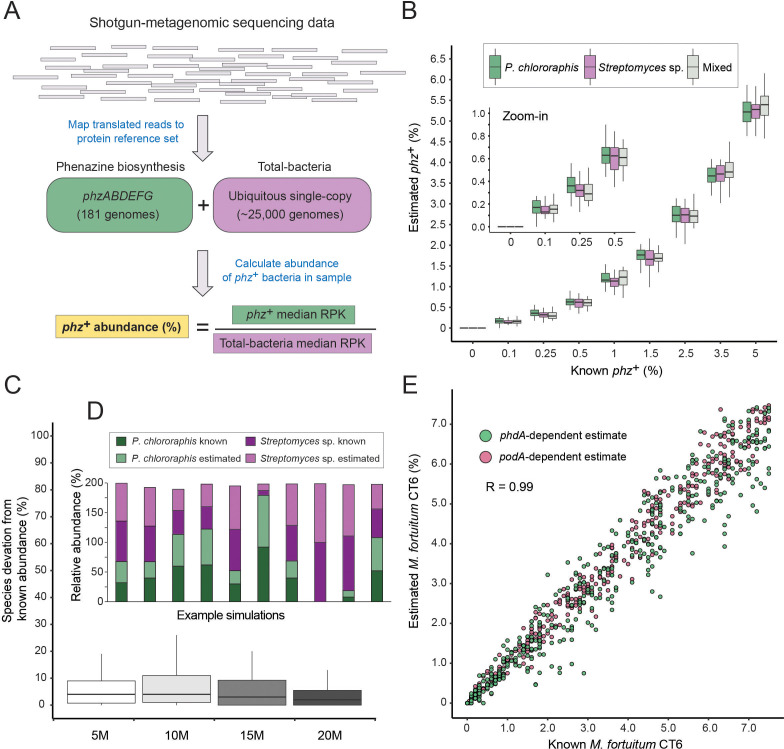
Figure 2. A method for estimating the abundance of phz+ bacteria using shotgun-metagenomics.
(A) Schematic representation of the computational approach. Phenazine producer abundance is calculated using the median Reads Per Kilobase (RPK) levels. (B) Validation results using simulated communities. Box plots represent different producer combinations as indicated in the legend. Each boxplot represents data from simulations performed with 80% amino-acid identity threshold and across 5–20M library coverages (n = 48 per individual boxplot). The black bar represents the box median. (C) Accuracy in measuring relative abundance of multiple phz+ species in a mixed community. Y-axis shows the difference between known and estimated species abundance across the indicated library coverages, considering samples with >0.1% phz+ bacteria. (D) Example of individual simulation results with two different phz+ bacteria. Similar heights of dark and light column portions represent good agreement between known and estimated levels. (E) Scatter plot depicting phenazine degrader (M. fortuitum CT6) frequency estimates at a gradient of known levels in simulated metagenomes. M. fortuitum levels are estimated using either phdA or podA genes, shown in pink and green, respectively.
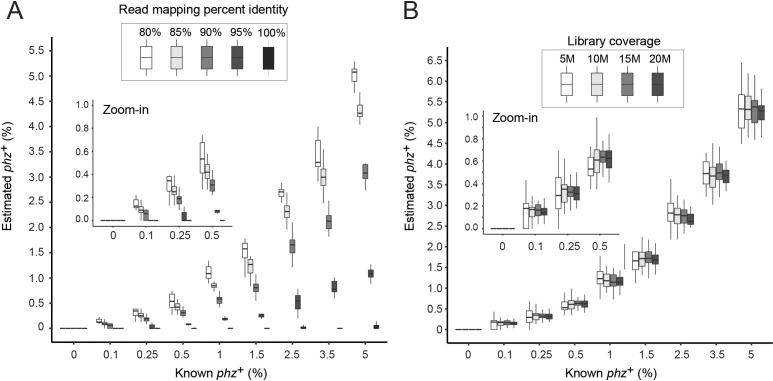
Figure 2—figure supplement 1. Benchmarking with mapping and library coverage parameters.
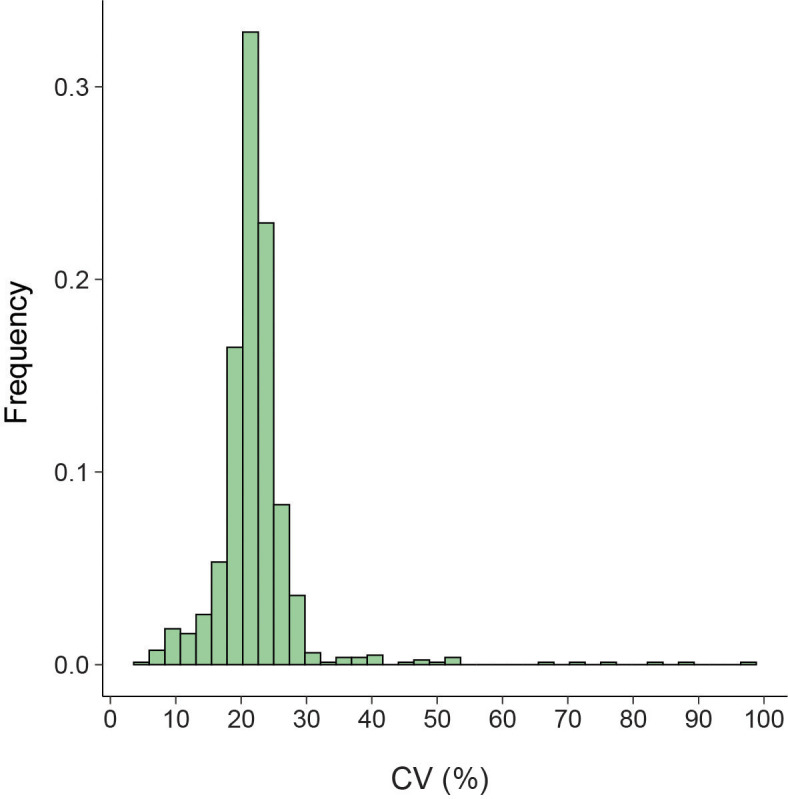
Figure 2—figure supplement 2. Low variation in bac120 reference gene coverage across samples.


