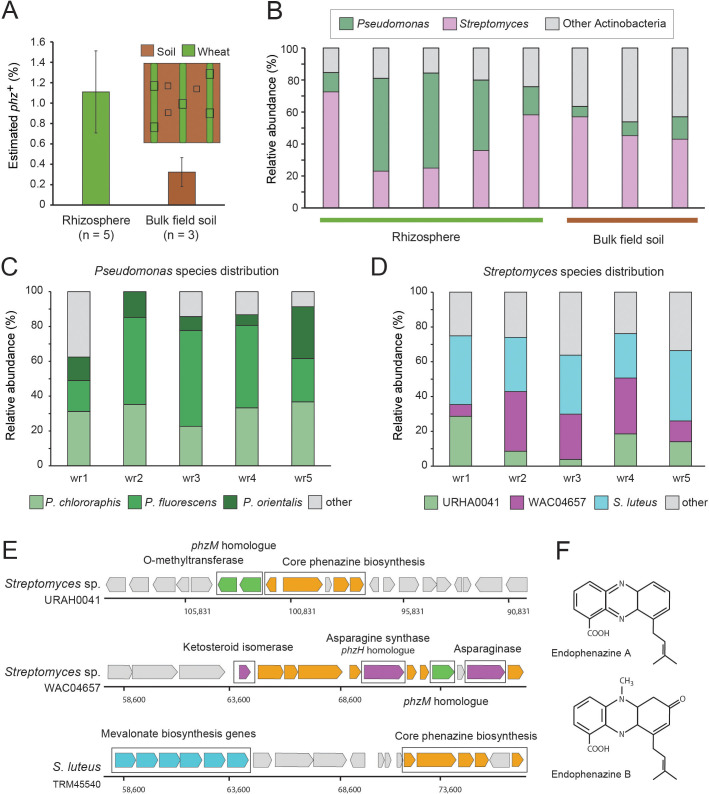
Figure 3. Field validation in the wheat rhizosphere.
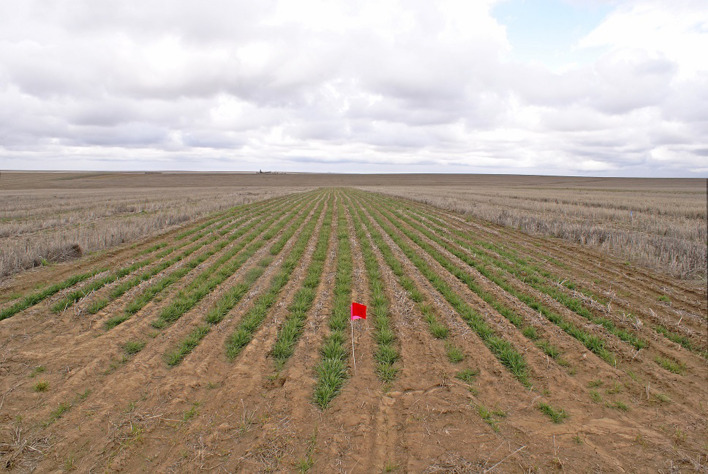
(A) Illustration of sample collection and metagenomic results. Green and brown stripes represent planted wheat rows and field soil, respectively. Black boxes depict sampling sites. Estimated phz+ levels in wheat rhizospheres and soil collected between planted rows. Error bars represent standard deviation. (B) Order level taxonomic distribution of phz+ bacteria within each sample. Y-axis describes the relative abundance of each order out of all phz+ bacteria. (C–D) Species level phz+ distributions across wheat rhizosphere samples (wr1-wr5). (E) Genomic regions displaying phenazine core and modification genes in the main Streptomyces groups detected in the rhizosphere. Specific modification genes are annotated in the figure. (F) Chemical structures of representative prenylated phenazines predicted to be produced by the mevalonate pathway highlighted in the S. luteus genomic region in E.


