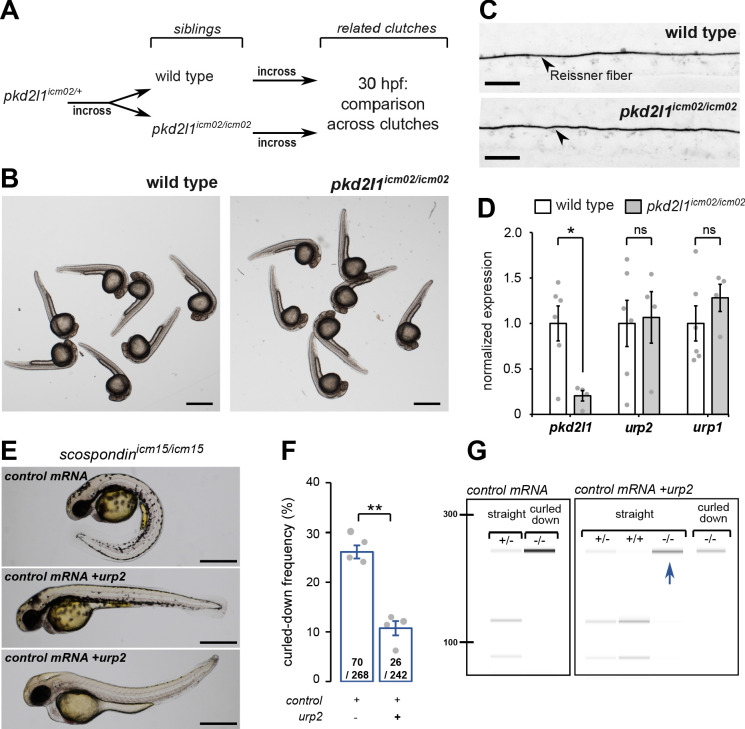
Figure 3. urp2 expression is Pkd2l1-independent and is important for the Reissner fiber-dependent straightening of the embryonic posterior axis.
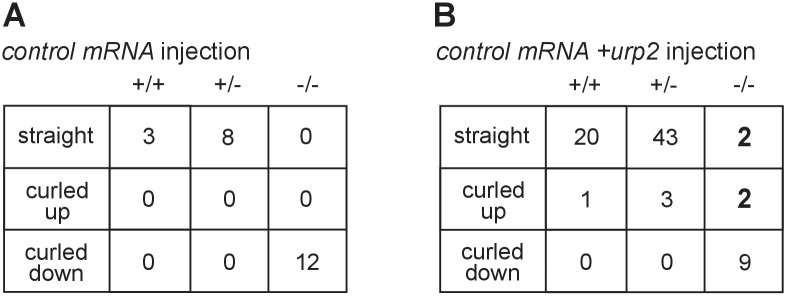
(A) Adult wild-type and pkd2l1icm02/icm02 siblings were incrossed to generate related clutches that were analyzed at 30 hpf. (B) Representative pictures of wild-type (left) and pkd2l1icm02/icm02 embryos (right) at 30 hpf. Note that mutant embryos develop a straight posterior axis. Scale bar: 0.5 mm. (C) Representative immunohistochemistry for the Reissner fiber imaged from the spinal cord of a wild-type (top, one representative embryo out of 20) and a pkd2l1icm02/icm02 embryo (bottom, one representative embryo out of 20). Note that the Reissner fiber forms properly in the mutant. Scale bars: 10 µm. (D) qRT-PCR analysis of mRNA levels of pkd2l1, urp2, and urp1 in wild-type (white) and pkd2l1icm02/icm02 embryos (grey). Data are represented as mean ± SEM. N = 6 independent replicates for wild-type and four for pkd2l1icm02/icm02. Each point represents a single experimental replicate. ns p>0.05, *p<0.05 (unpaired t-test). (E) Representative pictures of scospondinicm15/icm15 mutant embryos at 48 hpf after one cell stage injections of a control mRNA alone or of a mix containing a control mRNA and urp2 mRNA (middle and bottom). Note that upon control injections, scospondinicm15/icm15 mutants display at typical curled-down phenotype, while urp2 overexpression can lead to straightened (middle) or slightly curled-up posterior axis (bottom). Scale bar: 0.5 mm. (F) Quantification at 48 hpf of curled-down frequency in embryos obtained from scospondinicm15/+ incrosses upon control mRNA injections (n = 70 curled-down animals out of 268) or urp2 mRNA overexpression (26 curled-down embryos out of 242). Data were collected from four independent clutches and represented as mean ± SEM. **p<0.01 (paired t-test). (G) Injected embryos were genotyped at 48 hpf based on the loss of a restriction site in the scospondin mutant allele leading to a band resistant to digestion (-/-). While mutant animals are exclusively curled-down in control conditions, urp2 mRNA overexpression leads to the detection of mutant animals displaying a straight body axis (blue arrow). See also Figure 3—figure supplement 1.


