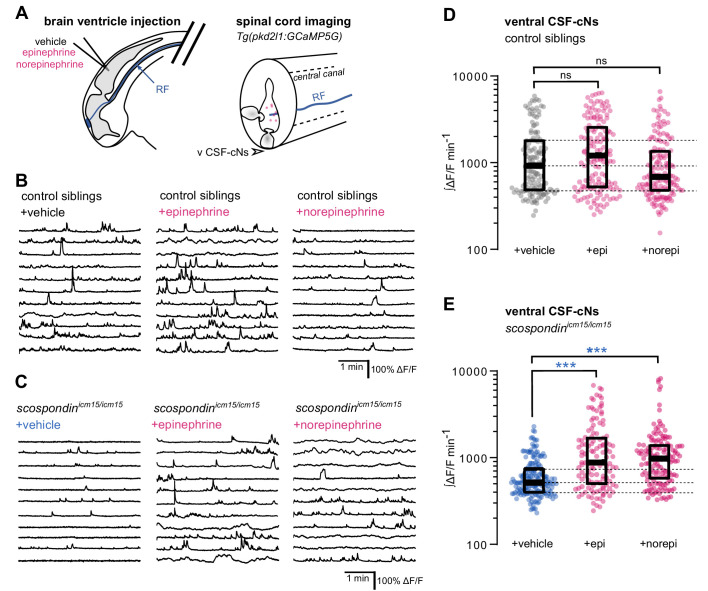
Figure 5. Local monoamine delivery restores calcium variations of ventral CSF-contacting neurons in scospondin mutants.
(A) Tg(pkd2l1:GCaMP5G) embryos we used to perform hindbrain ventricle injections at 30 hpf of artificial CSF (vehicle), epinephrine or norepinephrine (left). Intracellular calcium variations in ventral CSF-contacting neurons (v CSF-cNs, arrowhead) were recorded in the spinal cord 30 min after the injection to allow monoamines (pink dots) diffusing down the central can where bathes the Reissner fiber (RF) in control embryos. (B, C) Representative traces of calcium variations of individual ventral CSF-contacting neurons in control siblings (B) and scospondinicm15/icm15 mutants (C) after vehicle (left), epinephrine (middle) and norepinephrine injections (right). Sample traces from individual cells with integral ΔF/F values ranging around the median distribution of the imaged population are represented for each condition (n = 11). (D, E) Quantification of the normalized integrated intracellular calcium variation over time of ventral CSF-contacting neurons in control siblings (D) and scospondinicm15/icm15 mutants (E). Data were collected from three independent experiments and include 9, 11, and 12 control embryos recorded after vehicle, epinephrine and norepinephrine injections respectively (n = 131, 150, and 164 cells respectively) and 11, 10, and 10 scospondinicm15/icm15 mutants after vehicle, epinephrine and norepinephrine injections respectively (n = 168, 124, and 150 cells respectively). Each point represents a single cell. Bottom and top edges of the boxes indicate the 1st and 3rd quartiles. Dotted lines represent the distribution range around the 1st and 3rd quartiles of control embryos injected with a vehicle solution. Bold lines represent the median value for each distribution. ns p>0.05, ***p<0.001 (Kolmogorov-Smirnov test). See also Figure 5—figure supplement 1 and Figure 5-video 1.


