. 2020 Oct 15;9:e51796. doi: 10.7554/eLife.51796

Figure 1. Single-cell RNA-seq profiling of microglia under CSF1R inhibition and early repopulation.

(a) Experimental design for microglia depletion and repopulation. Mice were placed on PLX diet (1200 mg/kg) for 14 days to deplete microglia (D0). The early stage microglial repopulation (D2) group was switched to control diet (CD) for 2 days. Microglia from each mouse were collected on the same day. A total of 15 female C57BL/6J mice (5 Mo) were used: Ctrl (n = 3); D0 (n = 6, two brains pooled together for FACS); D2 (n = 4, two brains pooled together for FACS); (b) Workflow of adult microglia isolation procedures for scRNA-seq capture. Detailed description in methods. (c) Heatmap showing the top 180 variable genes detected from 28,649 cells after initial data filtering. (d) UMAP plot showing nine distinctive clusters identified from the scRNA-seq data. (e–h) Violin plot showing expression of Itgam, Aif1, Cx3cr1, and Csf1r in all clusters. Clusters 6, 7, 8, and 9 were removed from downstream data analysis. (i) Reclustered UMAP after removal of clusters 6–9 showing five distinctive clusters. (j) UMAP split by experimental conditions. (k) Ratio of cells from three treatment groups distributed in each cluster. Ratio of cells was calculated by normalizing to the total number of cells captured in each sample (n = 3 for Ctrl and D0, two for D2). Data shown as mean ± SEM. p-values were calculated using the negative binomial generalized linear model from EdgeR. *p≤0.05; ***p≤0.001.

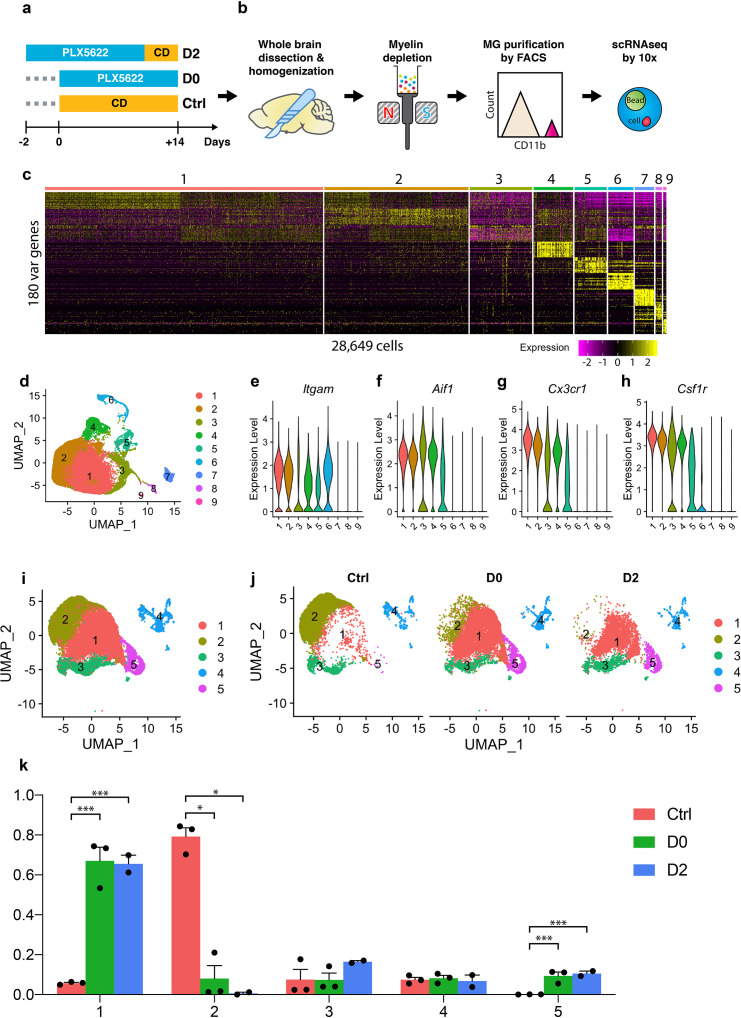
Figure 1—source data 1. Cell distribution in each cluster.

Figure 1.

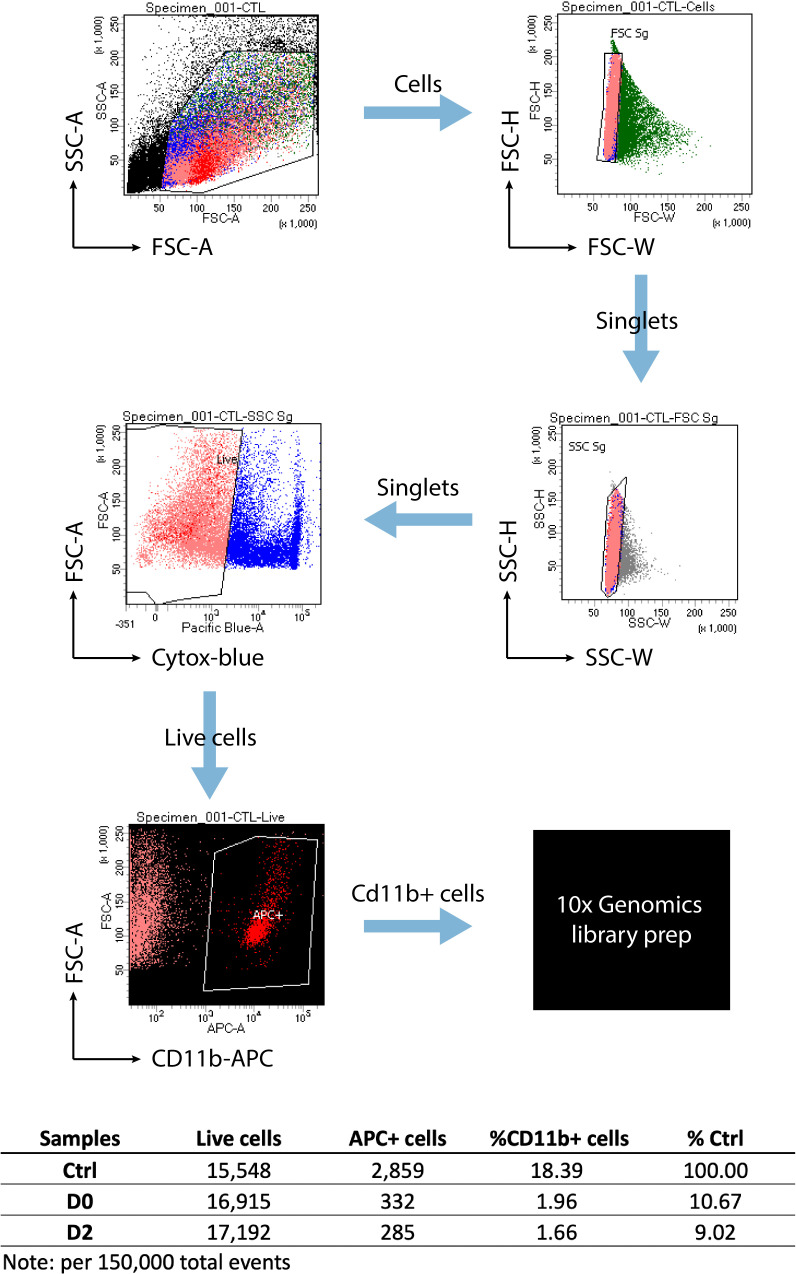
Figure 1—figure supplement 1. FACS strategy for single-cell microglia isolation.

Figure 1—figure supplement 1.

Gating plots used for cell sorting are shown. Plots were generated using BD FACSDiva software. The table at bottom shows the summary from 150,000 events recorded.
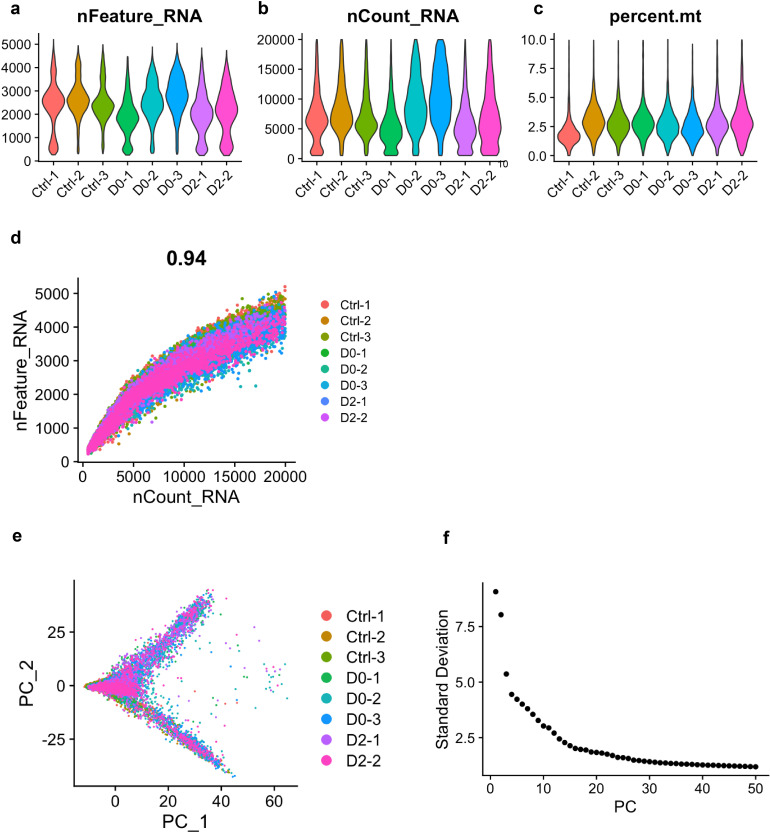
Figure 1—figure supplement 2. scRNA-seq data quality-control metrics.

Figure 1—figure supplement 2.

(a) Violin plot showing UMI counts for each treatment group. (b) Violin plot showing total number of genes for each treatment group. (c) Violin plot showing the parentage of mitochondrial genes per cell for each treatment group. (d) Scatter plot showing the correlation between total number of genes detected and total number of UMI counts. Pearson correlation (0.93) is shown. (e) Scatter plot from principle component analysis (PCA). PC1 and PC2 are shown. (f) Elbow plot showing standard deviation of the first 50 principle components from PCA. Principle components 1 to 10 were used as input for downstream UMAP analysis.
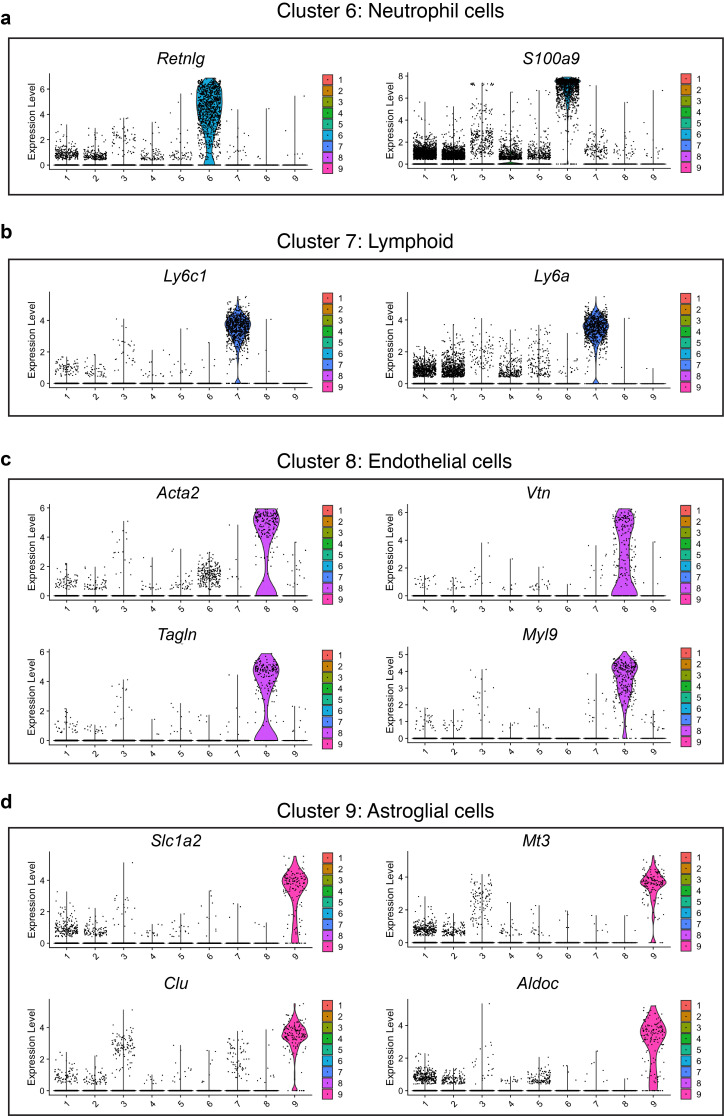
Figure 1—figure supplement 3. Expression of selected marker genes in clusters 6, 7, 8, and 9.

Figure 1—figure supplement 3.

(a–c) Violin plots showing the expression of selected marker genes in Cluster-6 (a), Cluster-7 (b), Cluster-8 (c) and Cluster-9 (d).
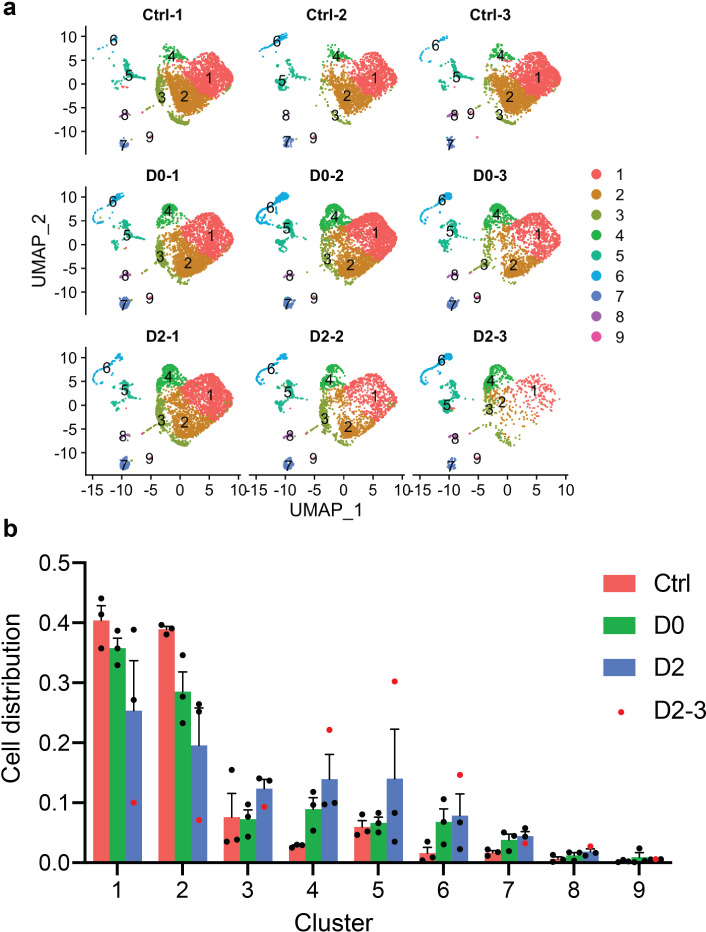
Figure 1—figure supplement 4. Justification of the removal of sample D2-3.

Figure 1—figure supplement 4.

(a) UMAP split by samples showing that D2-3 had fewer cells than the other samples. (b) Ratio of cells from three treatment groups distributed in each cluster. Ratio of cells was calculated by normalizing to the total number of cells captured in each sample. Red dots represent sample D2-3.