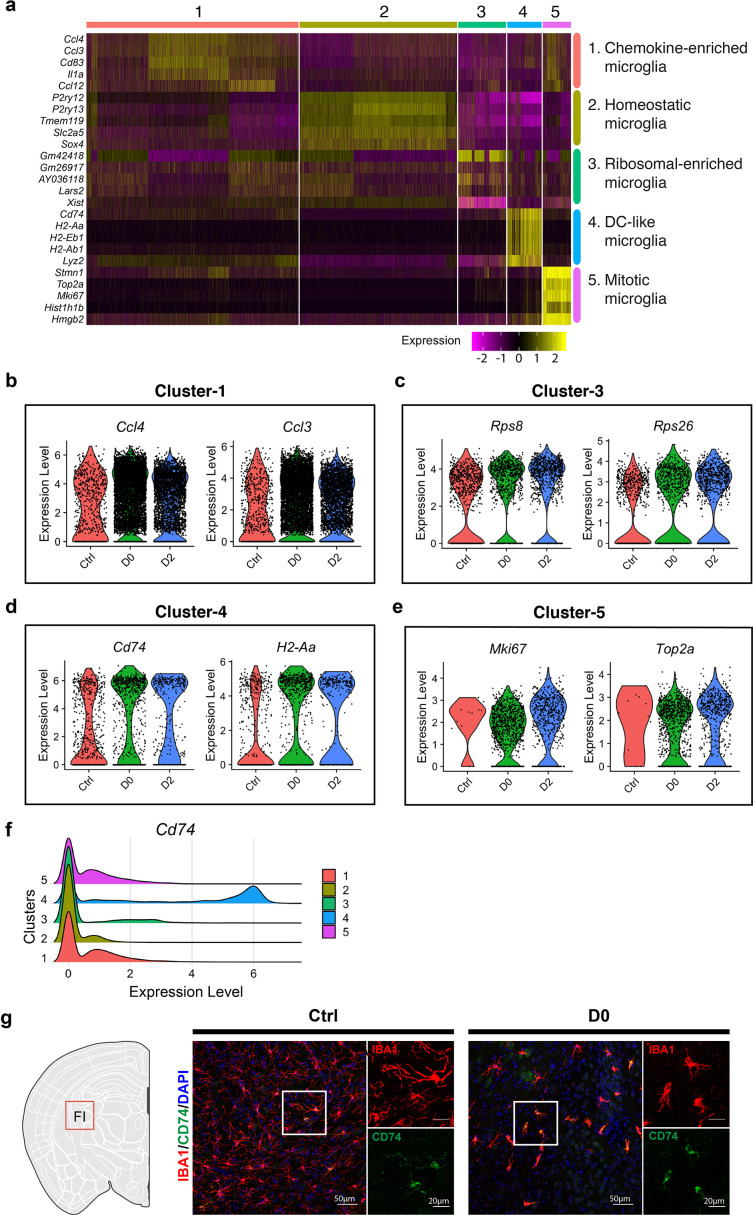
Figure 2. Cluster identity reveals heterogenous microglial population.
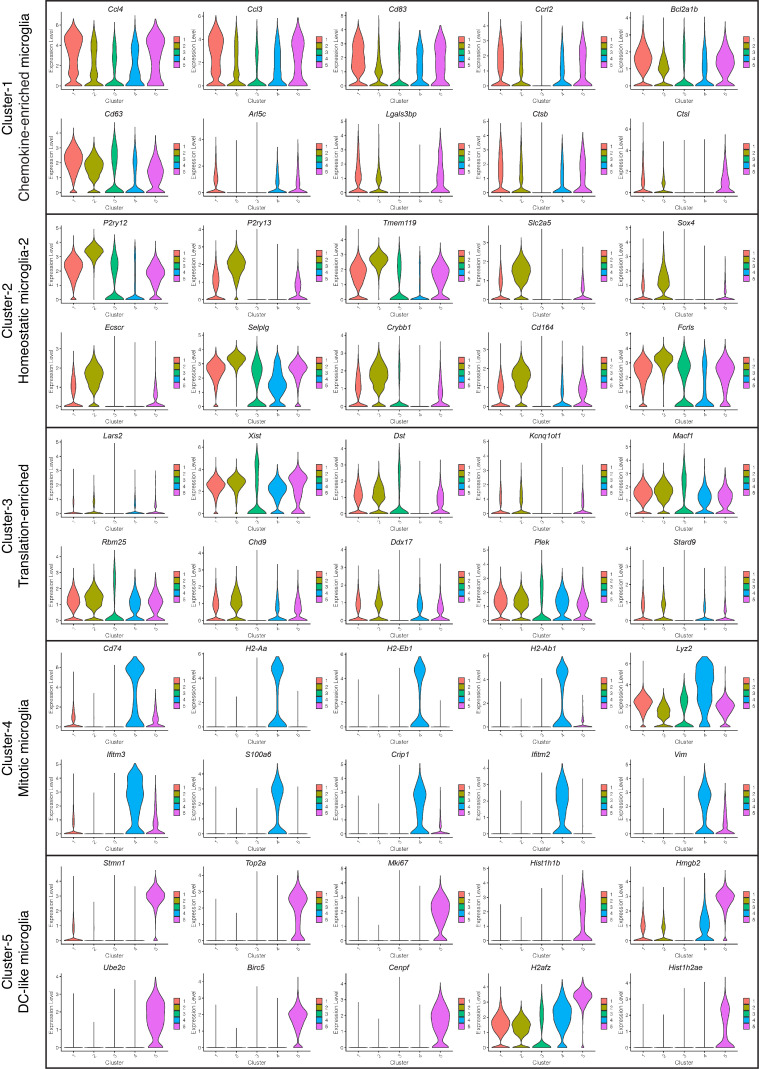
(a) Heatmap showing top-5 marker genes identified from each cluster. Complete list of marker genes can be found in Figure 2—source data 1. Annotation for each cluster is shown on the right. (b–e) Violin plot showing expression of selected marker genes in Cluster-1 (b), Cluster-3 (c), Cluster-4 (d) and Cluster-5 (e) in naïve C57BL/6J mice (Ctrl), PLX-treated mice (D0, 2 weeks of PLX diet) and repopulating (D2, 2 days after the end of treatment) brains. (f) Ridge plot showing expression of Cd74 in clusters 1–5. (g) Representative confocal images showing immunofluorescence staining of CD74 (green) and IBA1(red) in Ctrl and D0 brains. Images were taken from the fimbria (FI).


