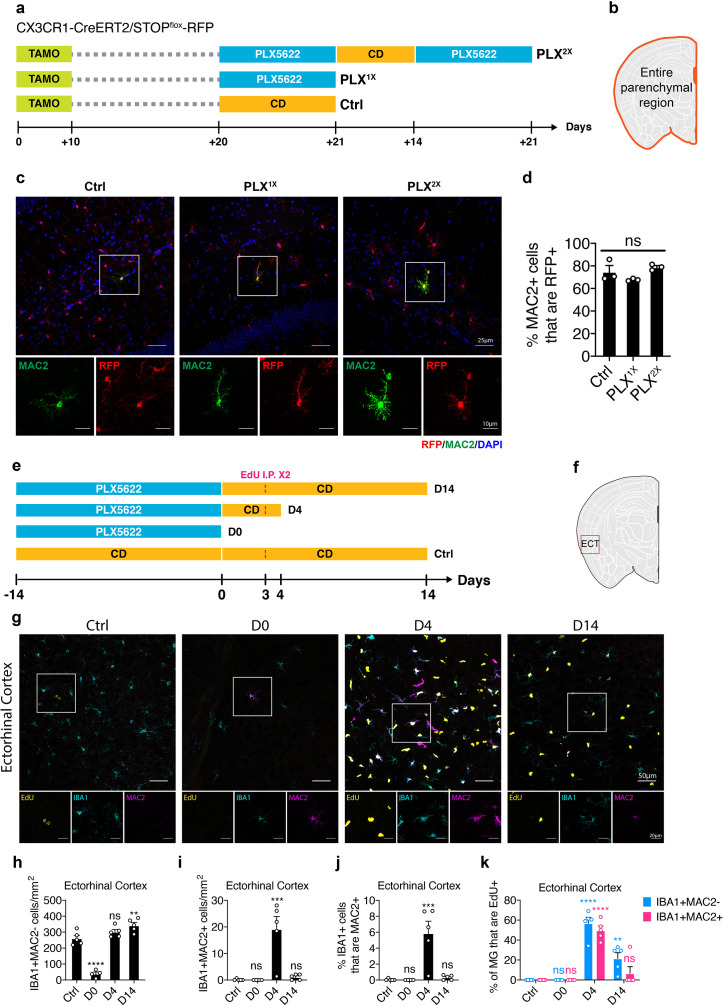
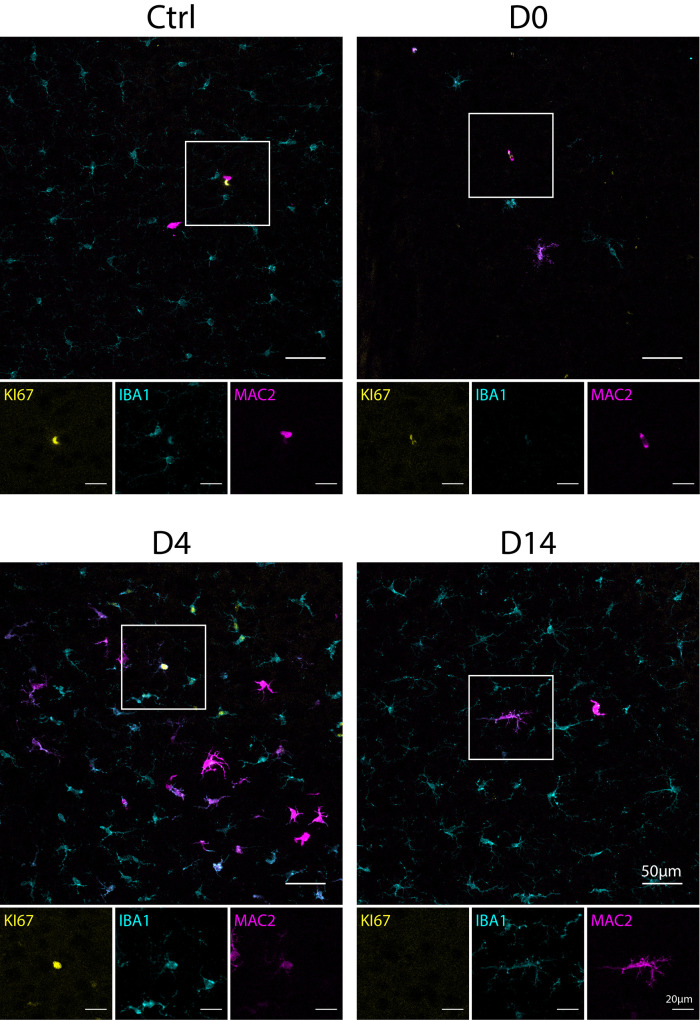
Figure 5. Lineage mapping shows MAC2+ microglia are not derived from circulating monocytes.
(a) Experimental design of the lineage mapping. Cx3Cr1-CreERT2/Rosa26-stop-DsRed mice were injected with tamoxifen (10 days) to label microglia with RFP. Mice are either treated with PLX diet for 3 weeks (PLX1X) or underwent repopulation for 2 weeks and treated with PLX diet again for another 3 weeks (PLX2X). (b) Quantification area was performed on the entire parenchymal region. (c) Representative confocal images showing colocalization of MAC2 and RFP expression. Boxed area is enlarged and separated by each channel. Images were collected from the hippocampal region. (d) Quantification of the percentage of MAC2+ cell that are RFP+. Number of CX3CR1-CreERT2/Rosa26-stop-DsRed mice (7–9 Mo) used: Ctrl (n = 3); PLX1X (n = 3); PLX2X (n = 3). One-way ANOVA was used. p-value summary is shown as ns (p>0.05); * (p≤0.05); ** (p≤0.01); *** (p≤0.001); **** (p≤0.0001). (e) Experimental design of microglial repopulation timeline and EdU injections. C57BL/6J mice were treated with PLX diet for 2 weeks (D0) and switched to control diet (CD) to start repopulation for 4 days (D4) or 14 days (D14). EdU was injected on repopulation day 3. (f) Brain region used for quantification. Quantification in panel (h–k) was performed on images (1292.23 μm x 1130.7 μm) collected at the Eentorhinal cortex (ECT) using the VERSA automated slide scanner (Leica, 20x lens). (g) Representative confocal images showing immunofluorescence staining of EdU (yellow), IBA1 (cyan), and MAC2 (magenta) in the entorhinal region. Boxed area is shown by separated channels at the bottom. (h) Quantification of IBA1+MAC2- cells in the ECT. (i) Quantification of IBA1+MAC2+ cells in the ECT. (j) Quantification of the percentage of IBA1+ microglia that are MAC2+ in the ECT. (k) Quantification of the percentage of EdU+ labeling in either IBA1+MAC2- cells (blue bar) or IBA1+MAC2+ cells (red bar). Number of C57/BL6 mice (2–3.5 Mo) used: Ctrl (n = 5); D0 (n = 4); D4 (n = 5); D14 (n = 5). Statistical tests used: (1) In panels (h–j), one-way ANOVA with Dunnett's multiple comparisons test was used to compare with Ctrl; (2) In panels (k), two-way ANOVA with Dunnett's multiple comparisons test was used to compare with Ctrl for each cell population. p-value summary is shown as ns (p>0.05); * (p≤0.05); ** (p≤0.01); *** (p≤0.001); **** (p≤0.0001).


