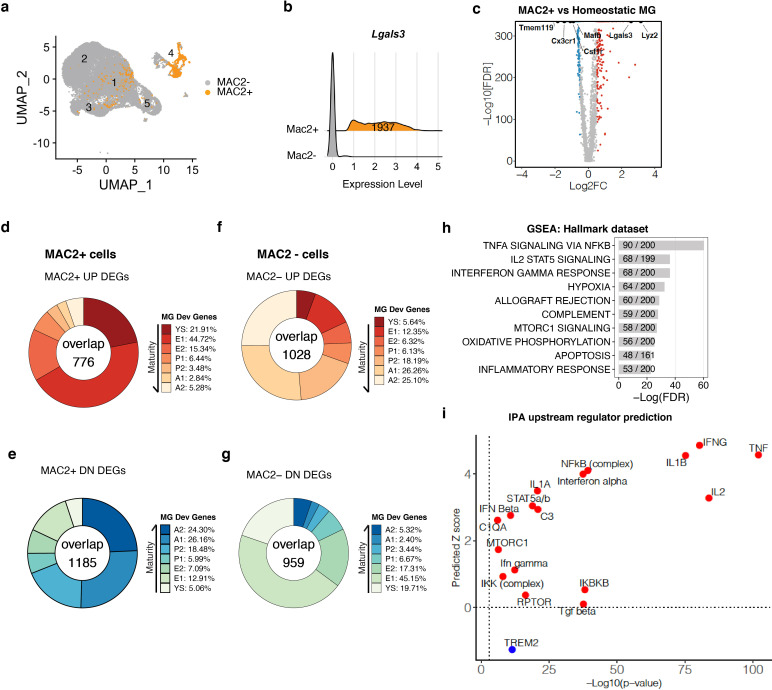
Figure 6. MAC2+ cells display immature microglial signatures (a) UMAP plot showing the spatial distribution of MAC2+ cells in different clusters.
(b) Ridge plot showing isolation of MAC2+ cells from all clusters. MAC2+ cells were separated based on high Lgals3 expression (mean plus one SD). (c) Volcano plot showing differentially expressed genes (DEGs) in MAC2+ cells compared to homeostatic microglia from Control condition (Cluster 2). Upregulated DEGs are colored in red and downregulated DEGs are colored in blue (log fold change >0.5 or <−0.5). Genes of interest are highlighted in text. (d,e) Donut chart showing the percentage of upregulated DEGs (d) and downregulated DEGs (e) in MAC2+ cells overlapping with developmental marker genes identified in Matcovitch-Natan and Winter et al. (f,g) Same analysis as in d,e, for DEGs in MAC2- cells. (h) Bar plot showing top-10 hallmark pathways enriched in all MAC2+ DEGs from Gene Set Enrichment Analysis (GSEA). The fraction in the bar shows the number of genes found in the DEGs (numerator) over the number of total genes curated for the corresponding pathway (denominator). (i) Scatterplot showing selected upstream regulators and their predicted z scores against the -Log10(p-value) based on all MAC2+ DEGs using Ingenuity Pathway Analysis (IPA).


